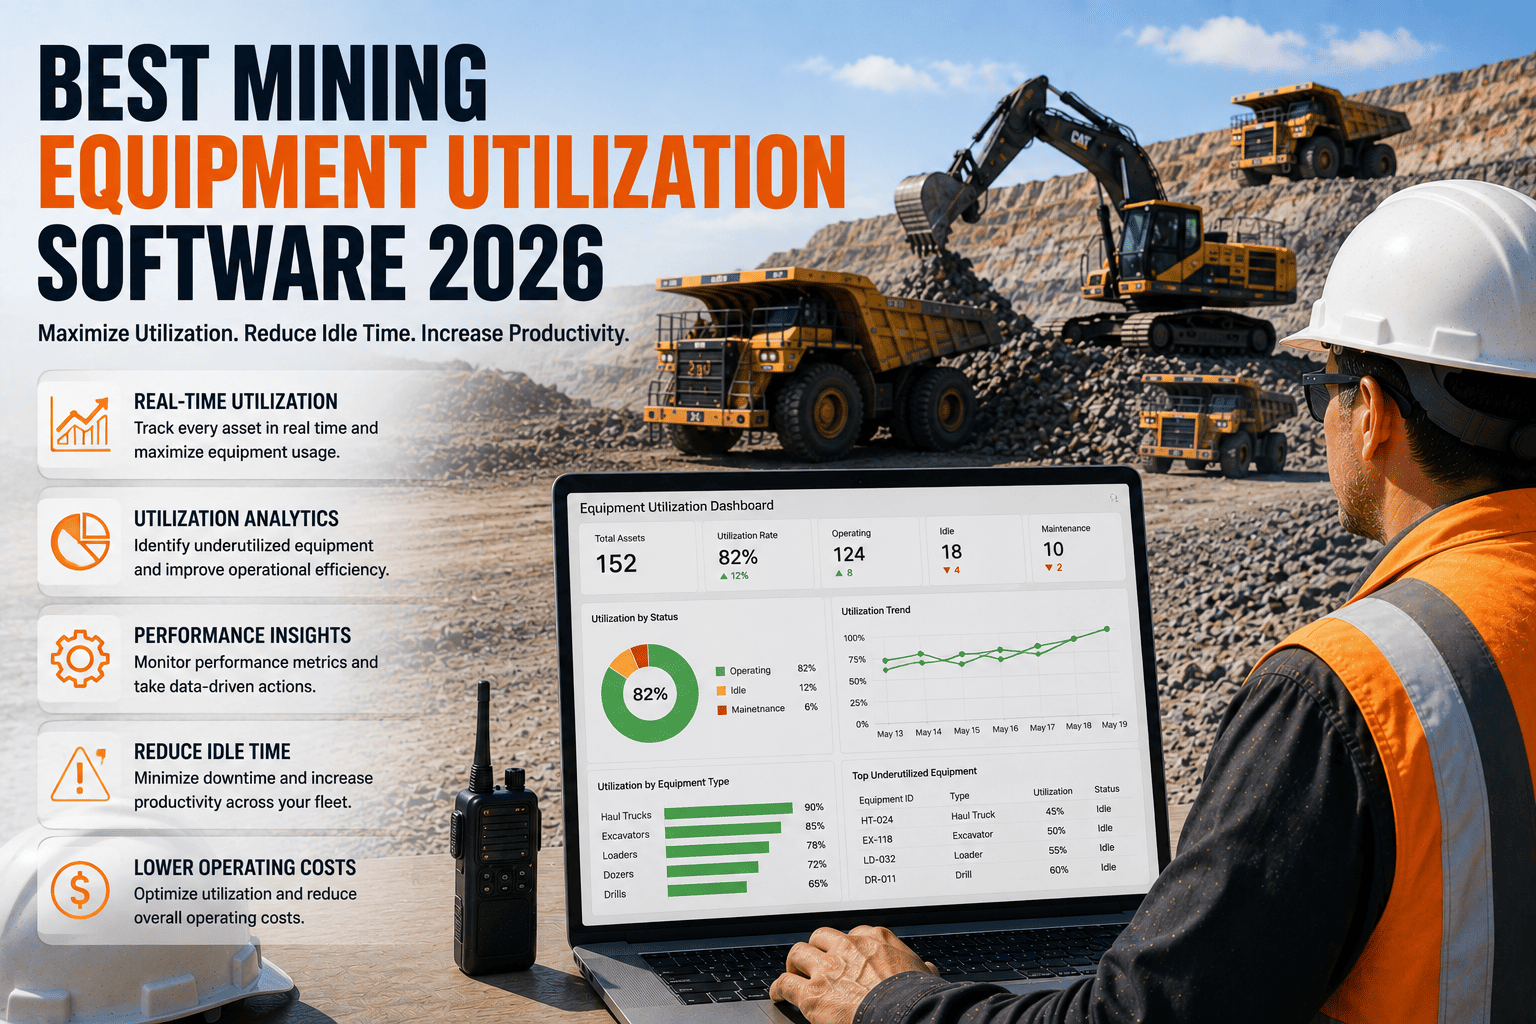
A haul truck can be sitting on the schedule, fueled, staffed, and mechanically sound, and still not be doing any actual work. It might be idling in a queue at the crusher, waiting on an operator assignment, or parked through a shift change nobody accounted for. None of that shows up as downtime. The truck is technically available. It is simply not being used, and that gap between available and used is where a shocking share of mining operating costs quietly disappears every month.
Mining equipment utilization measures how much of an asset's available time is spent actually producing, calculated as productive operating hours divided by available hours. Industry utilization typically runs 70 to 85 percent, but many fleets sit well below that because they only track whether a machine is mechanically available, not whether it is actually working. Utilization software closes that gap by tracking engine hours, idle time, and productivity per asset in real time. Sign up free or book a demo to see your fleet's real utilization numbers.
Utilization Is Not the Same Question as Availability
These two numbers get confused constantly, and the confusion costs money. Availability measures whether equipment is mechanically ready to work when scheduled, typically 85 to 95 percent for well-maintained mining fleets. Utilization measures something different: what percentage of that available time is actually spent producing. A truck can sit at 90 percent availability and still only hit 65 percent utilization if it spends the rest of its available hours idling in a queue, waiting for an operator, or sitting through a shift handover.
Two Very Different Gauges, One Truck
Mechanical Availability
The truck is ready to work almost every scheduled hour, mechanically sound and staffed.
Actual Utilization
Of that available time, over a third is spent idling, queueing, or waiting, not moving a single ton.
High availability with low utilization is one of the clearest signs of a dispatch, planning, or process bottleneck rather than a maintenance problem, and it is exactly the kind of gap that stays invisible without dedicated utilization tracking.
FleetRabbit measures engine hours, idle time, and productive output per asset continuously, so you see exactly how much of your available fleet time is actually turning into work.
What Utilization Software Actually Needs to Track
Utilization (%) is calculated as operating hours divided by total available hours, but a single percentage does not tell a mine manager what to fix. The software worth using breaks that number down into the signals that actually explain it.
Four Metrics That Turn a Percentage Into a Decision
Engine Hours vs. Productive Hours
The gap between the engine running and the machine actually producing exposes fuel and depreciation spent on zero output.
Idle Time Thresholds
Automatic alerts when an asset sits engine-on without activity past a set limit, so dispatch can redeploy it before cost accumulates further.
Productivity Per Hour
Tons moved or cycles completed divided by operating time, since a truck that is constantly moving but underloaded is still a cost leak even at high utilization.
Per-Asset Benchmarking
Comparing utilization machine by machine reveals which units are earning their place in the fleet and which are quietly dragging down fleet-wide ROI.
Where Most Mining Fleets Actually Stand
The gap between what a fleet believes about its performance and what the data shows is usually larger than expected. World-class mining operations target 70 to 85 percent utilization, but real-world studies of haul truck fleets have found utilization and effectiveness numbers well below that range once idle time, queueing, and shift-change gaps are fully accounted for.
| Metric | World-Class Target | Typical Reality Without Tracking |
|---|---|---|
| Equipment Availability | 85 to 95 percent | Often closer to 72 to 78 percent industry average |
| Equipment Utilization | 70 to 85 percent | Frequently masked by high availability, with true utilization sitting well under target |
| Idle Time Share | Below 10 to 15 percent of engine-on hours | Commonly 15 to 20 percent or higher, burning fuel with zero production |
| Overall Equipment Effectiveness | Above 85 percent | Industry average closer to 60 to 65 percent, with some fleets under 40 percent |
Why This Number Is Also a Fleet-Sizing Question
Without utilization data, mines tend to keep extra equipment "just in case." A loader that is genuinely needed 60 percent of the time still gets budgeted, insured, and maintained as if it runs at full capacity. Accurate utilization tracking exposes that gap directly, turning a vague sense that "we might need it" into a clear answer about whether an asset is actually earning its cost.
FleetRabbit calculates utilization, idle time, and cost per hour automatically for every asset, so fleet-sizing and redeployment decisions are based on real numbers instead of a hunch.
Frequently Asked Questions
The Bottom Line for Mining Fleet Managers
A schedule full of available machines is not the same thing as a schedule full of productive ones, and the gap between the two is where budgets quietly leak every month. Utilization software does not just report a percentage. It shows exactly which hours were lost to idling, queueing, or underloading, and which specific assets are worth keeping in the fleet at all. That is the difference between managing equipment by feel and managing it by the numbers.
FleetRabbit tracks engine hours, idle time, and productivity per asset in real time, turning available hours into a clear picture of what is actually earning its keep.







