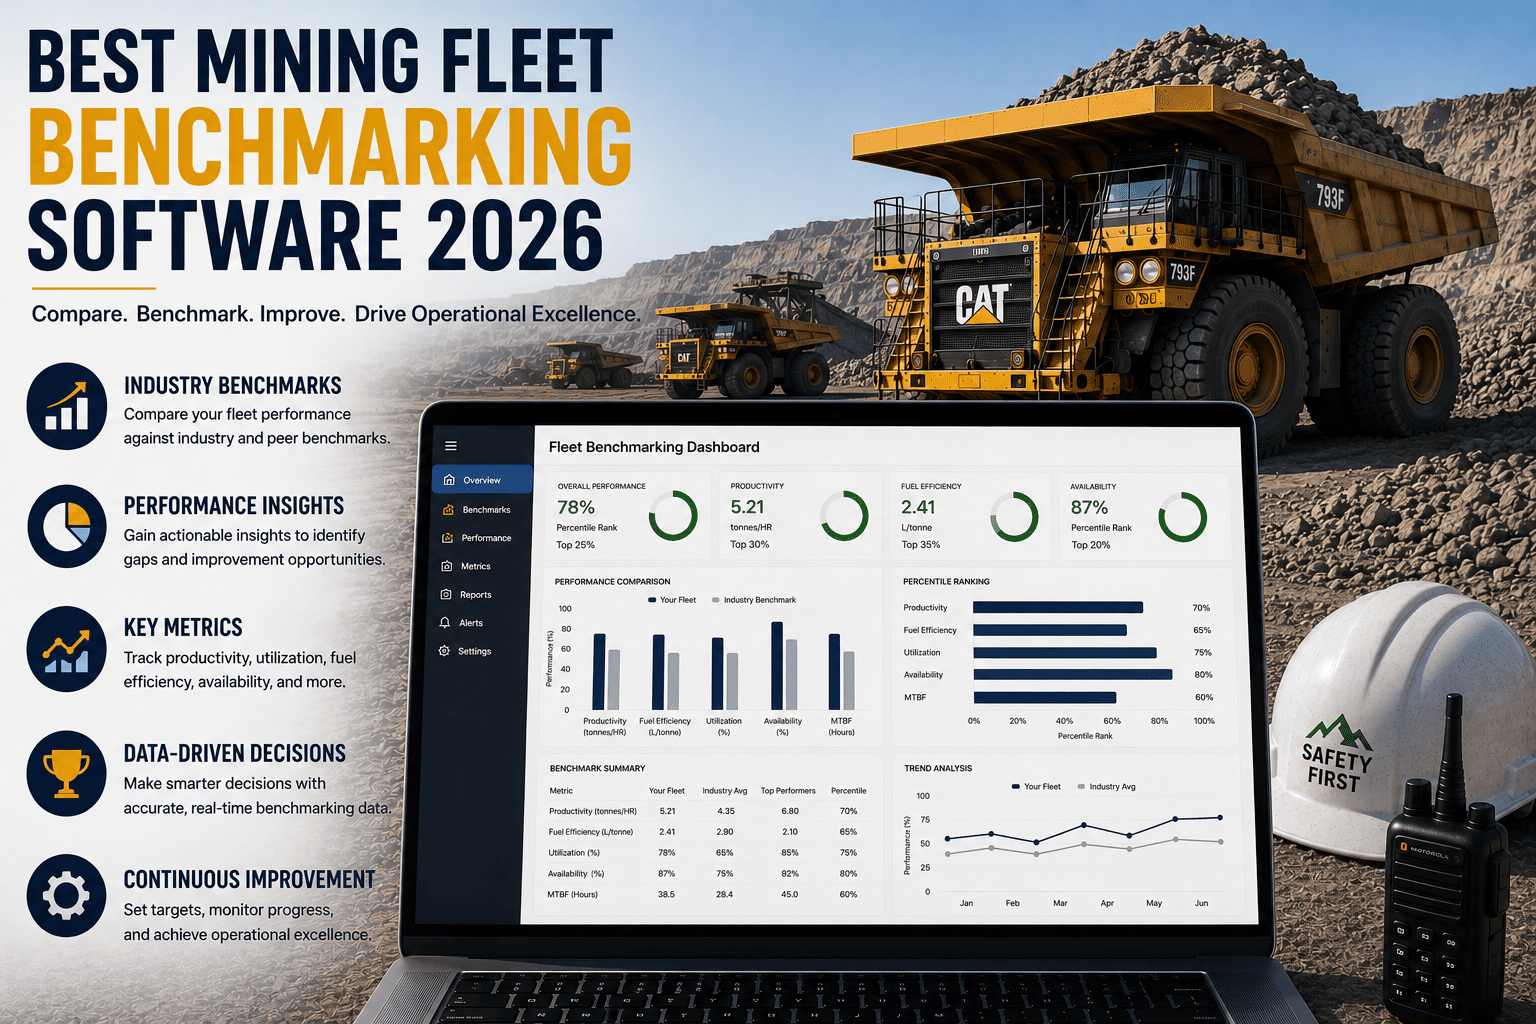
Ask five mine managers how their fleet is performing and you'll likely get five confident answers, and at least three of them will be wrong. Not because anyone is hiding anything, but because "performing well" without a benchmark is just a feeling. The mines pulling ahead of their peers aren't necessarily running newer equipment. They're the ones who know exactly where their availability, utilization, and cost per hour stand against industry standard, and exactly which number to move first.
World-class mining fleets target 85 to 95 percent equipment availability, 70 to 85 percent utilization, and Overall Equipment Effectiveness above 85 percent. Industry average OEE actually sits closer to 60 to 65 percent, and studies of real fleets have found truck OEE averaging under 40 percent. That gap between average and world-class performance is exactly what benchmarking software is built to close.
Why Benchmarking Changes How You Run A Fleet
A single number in isolation, "our trucks were available 88 percent of the time last month," tells you almost nothing on its own. Is 88 percent good? Compared to what? Benchmarking answers that question by putting your number next to an industry standard, a historical trend, or a sister site running similar equipment in similar conditions. Once that comparison exists, a flat number turns into a clear signal: either you're ahead of standard and should protect what's working, or you're behind and now know exactly how far.
The Gap Between Average And World-Class Is Larger Than Most Sites Assume
Research into real truck-shovel fleets has found Overall Equipment Effectiveness averaging well under 40 percent for trucks and even lower for shovels, driven mostly by suboptimal dispatch and coordination rather than mechanical failure. That's a wide gap from the 85 percent-plus OEE that defines world-class performance, and it means most fleets have significant, addressable upside sitting in dispatch and scheduling decisions rather than in equipment purchases.
Standardized Definitions Make Comparison Possible
Benchmarking only works if everyone agrees on what counts as downtime, delay, or idle time. Industry frameworks for standardized time classification exist precisely so that an availability number from one site means the same thing as an availability number from another. Without that consistency, comparisons quietly become meaningless. Signing up for a free trial gives your fleet consistent, standardized metrics from day one instead of numbers that don't line up across shifts or sites.
FleetRabbit tracks availability, utilization, OEE, and cost per hour continuously, then benchmarks your fleet against industry targets so you know exactly which metric to fix first. Start a free trial with 3 vehicles and see your current standing today.
The KPIs Every Mining Fleet Should Benchmark
Not every metric deserves equal attention. These four consistently separate world-class fleets from average ones, and each has a clear industry target to measure against.
| KPI | What It Measures | World-Class Target | Typical Industry Average |
|---|---|---|---|
| Equipment Availability | Percentage of scheduled time equipment is mechanically ready to operate | 85 to 95 percent | 72 to 78 percent |
| Utilization Rate | Percentage of available time equipment is actually producing | 70 to 85 percent | Often well below target due to dispatch delays |
| Overall Equipment Effectiveness | Combined score of availability, utilization, and performance | 85 percent or higher | 60 to 65 percent, sometimes far lower for mobile fleets |
| Mean Time Between Failures | Average operating time between unplanned breakdowns | Exceeding 800 hours for major equipment classes | Typically 400 to 600 hours |
How Mining Fleet Benchmarking Software Works
Benchmarking software replaces the manual spreadsheet exercise, usually done monthly or quarterly if at all, with a continuously updated view of how your fleet compares to standard.
Standardized Metric Collection Across Every Machine
Telematics and dispatch data feed the platform continuously, calculating availability, utilization, and OEE using consistent, standardized definitions so every truck, shovel, and dozer is measured the same way.
Side-By-Side Comparison Against Industry Targets
Rather than reading a raw percentage and guessing whether it's good, the software places your number directly next to the world-class target and the typical industry average, making the gap immediately obvious.
Root Cause Attribution By Shift, Unit, and Site
When a metric falls short, the platform breaks the shortfall down by shift, equipment unit, or pit location, so the conversation moves quickly from "utilization is low" to "night shift on the east pit has a dispatch delay problem."
Turning Benchmarks Into Action, Not Just Reporting
A benchmark that only lives in a quarterly report rarely changes behavior. Dashboards that update continuously and flag the specific unit or shift falling behind give supervisors something they can act on today, not next month. Booking a demo shows exactly how this looks against your own fleet's current numbers.
What Benchmarked Fleets Achieve
Sites that actively benchmark rather than reviewing performance informally consistently close the gap between their current numbers and world-class targets faster than sites relying on gut feel.
Getting Started With Fleet Benchmarking
Most sites already collect enough telematics and dispatch data to calculate availability, utilization, and OEE, the missing piece is usually a consistent framework to calculate them the same way every time and a target to compare them against. A short trial period is typically enough to see exactly where your fleet sits relative to world-class standard, and which single metric offers the fastest win.
From there, the software keeps the comparison live, updating as conditions change rather than waiting for the next quarterly review. You can start a free trial to see your current benchmark standing, or book a short demo to walk through the KPIs that matter most for your fleet first.
A number without a benchmark is just a feeling. FleetRabbit shows you exactly where your availability, utilization, and OEE stand against world-class targets, and which metric to fix first.







