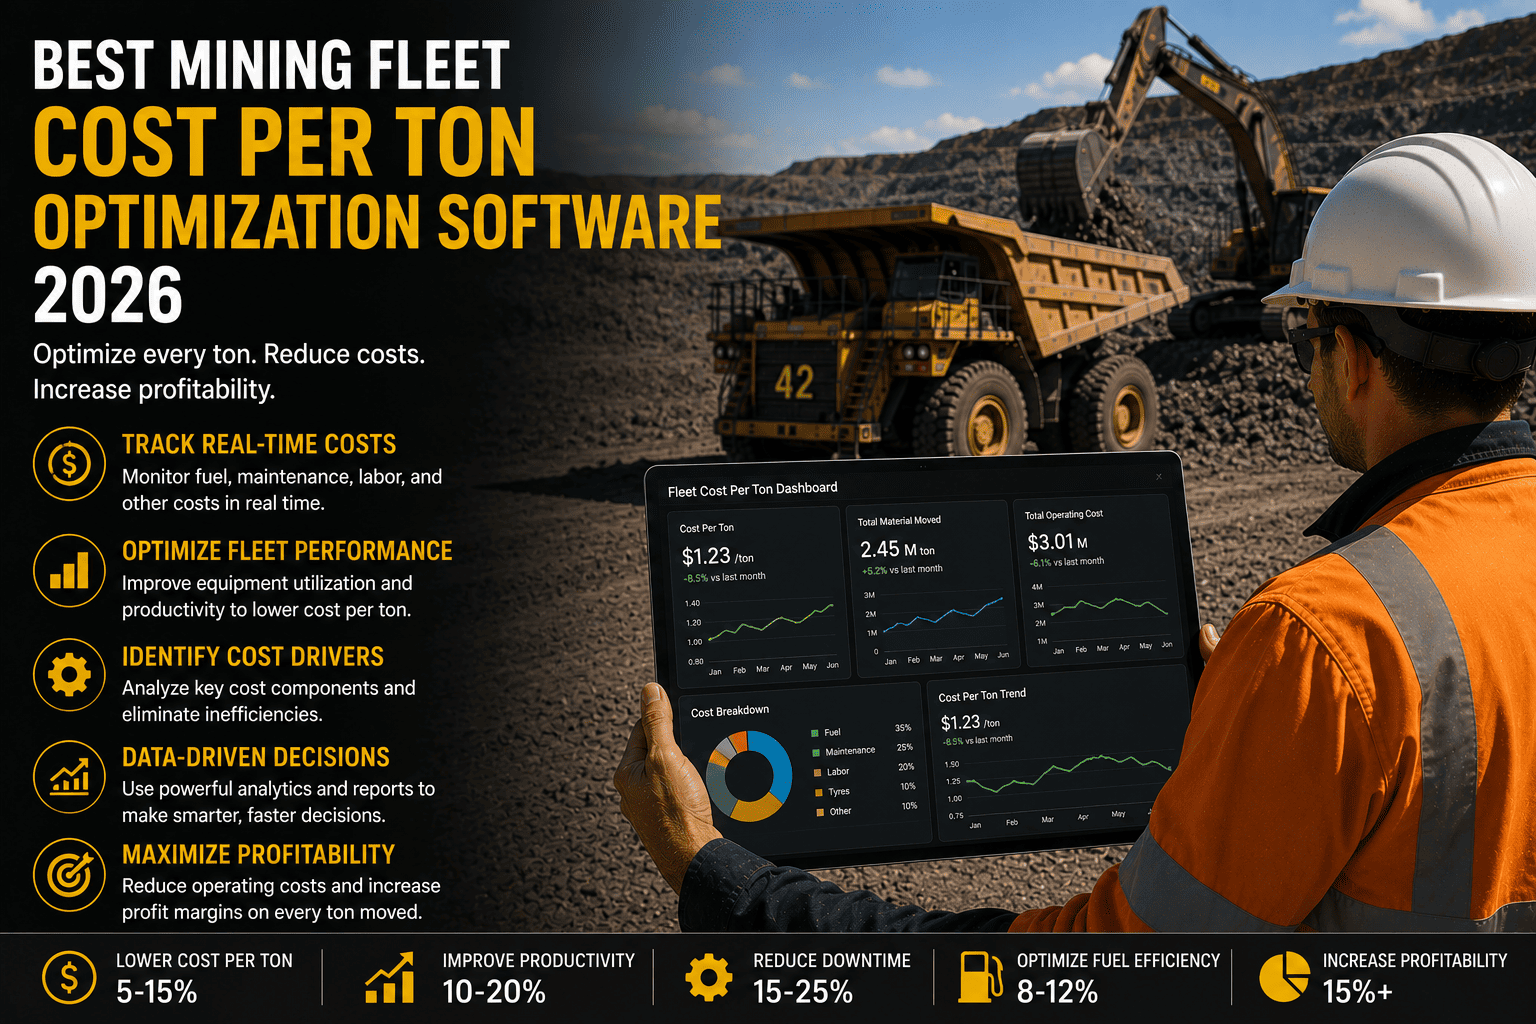
Ask ten mine managers what their cost per ton is and most can give you a number. Ask them which single decision moved that number last month, a route change, a shift in payload compliance, an operator's braking habits, a shovel-truck mismatch, and most go quiet. Cost per ton is the scoreboard everyone reports to the board, but on its own it tells you almost nothing about what to fix. The mines pulling ahead in 2026 are not the ones with the biggest trucks. They are the ones that broke that single number down into cycle time, payload, fuel, and maintenance cost, and built software that shows exactly which lever to pull first.
Cost per ton optimization software combines cycle time, payload utilization, fuel burn, and maintenance cost data into one live view, so mine managers can see which specific factor is driving cost up instead of reacting to a lagging monthly average. Mines using this kind of continuous analytics typically cut cost per ton by 8 to 15 percent within two quarters. You can sign up for FleetRabbit to see your own fleet's cost per ton broken down live.
Four cost inputs sit on top, one production number sits on the bottom. Optimization software works by shrinking the top and growing the bottom, cycle by cycle.
Why Cost Per Ton Alone Hides the Real Problem
Cost per ton is a lagging indicator. By the time it moves on a monthly report, the shift that caused it is long over, and the specific cause, a slow loader-truck pairing, a stretch of poor road condition, an operator burning extra fuel through hard acceleration, has already disappeared into the average. A single aggregated number cannot tell a supervisor what to fix on tomorrow's shift.
The Four Inputs That Actually Move the Number
Every dollar in cost per ton traces back to one of four places: how long each cycle takes, how much material each cycle actually carries, how much fuel is burned getting there, and how much the fleet costs to keep running. Optimization software separates these four inputs instead of blending them into one figure, so the fix that is available today gets applied today.
Averages Punish Your Best Equipment and Hide Your Worst
A single site-wide cost-per-ton figure treats your most efficient truck the same as your least efficient one. Underperforming assets get camouflaged inside the average while high performers get no credit for carrying the fleet. Breaking the number down per asset and per operator is what actually exposes where the savings are sitting.
The Hidden Cost Drivers Behind a Rising Cost-Per-Ton
Most mines already know their cost per ton is climbing. Few can point to why. The table below breaks down the drivers that quietly push the number up and what a well-built analytics platform does to catch each one early.
| Cost Driver | How It Inflates Cost Per Ton | What Optimization Software Catches |
|---|---|---|
| Extended Cycle Time | Every extra minute in the load-haul-dump-return loop spreads fixed costs over fewer tons | Route, shift, and loader-truck pairing breakdowns that isolate exactly where time leaks |
| Payload Under-Fill | A truck running below rated capacity burns the same fuel for less material moved | Per-cycle payload tracking against rated capacity, by shovel and by operator |
| Unplanned Downtime | A single idle haul truck costs thousands per hour with zero production to show for it | Engine-hour based maintenance alerts that catch failures before they take a truck offline |
| Fuel Burn Per Ton | Idle time, hard acceleration, and poor route choices burn fuel without moving material | Fuel-per-ton reporting tied to specific operators, routes, and equipment classes |
| Low Utilization | Scheduled hours that are not productive hours still accrue depreciation and labor cost | Utilization tracking that separates scheduled time from actual productive time per asset |
FleetRabbit tracks cycle time, payload, fuel burn, and maintenance cost per asset and per operator in real time, so you see exactly which lever is driving your cost per ton up before the monthly report ever lands on your desk.
How Optimization Software Actually Lowers the Number
Cost per ton does not drop from one big change. It drops from a repeatable process that catches small leaks before they compound across thousands of cycles a month.
Turning Utilization Data Into Fleet-Sizing Decisions
Once utilization is visible per asset instead of fleet-wide, replace-versus-repair and fleet-sizing decisions stop being guesswork. A truck that is scheduled constantly but rarely productive is not a capacity asset, it is a cost anchor, and the data makes that distinction obvious instead of buried in an averaged report.
Benchmarking Against Your Own History, Not Just Industry Averages
Industry benchmarks are a useful starting point, but the most actionable comparison is your own fleet against its own best month. Software that tracks trend lines per asset shows whether this quarter's cost per ton is genuinely improving or simply riding a good ore body.
Connecting Cost Data to Coaching, Not Just Reporting
A cost-per-ton dashboard only pays off if the outliers it flags turn into a specific conversation with a specific operator or crew. Platforms that tie cost data back to operator scorecards make that conversation concrete instead of generic.
If you want to see how these four cost inputs actually look against your own equipment and shift data, you can book a demo and walk through a live breakdown built from your operation's numbers.
FleetRabbit gives every mine manager a live view of cycle time, payload, fuel, and maintenance cost per asset, so the fix that lowers cost per ton gets applied on today's shift, not next month's report.
Frequently Asked Questions
Cost per ton will always be the number that goes on the board report, but it should never be the only number your team looks at day to day. The mines cutting real cost out of their operations in 2026 are the ones that broke that single figure down into cycle time, payload, fuel, and maintenance cost, and gave supervisors a live view of exactly which one to fix next. If you want to see that breakdown running against your own fleet's numbers, you can start a free trial or book a 30-minute demo with our team.
FleetRabbit breaks cost per ton down into cycle time, payload, fuel, and maintenance cost for every asset and operator, so your team fixes the actual driver instead of chasing a lagging monthly average.







