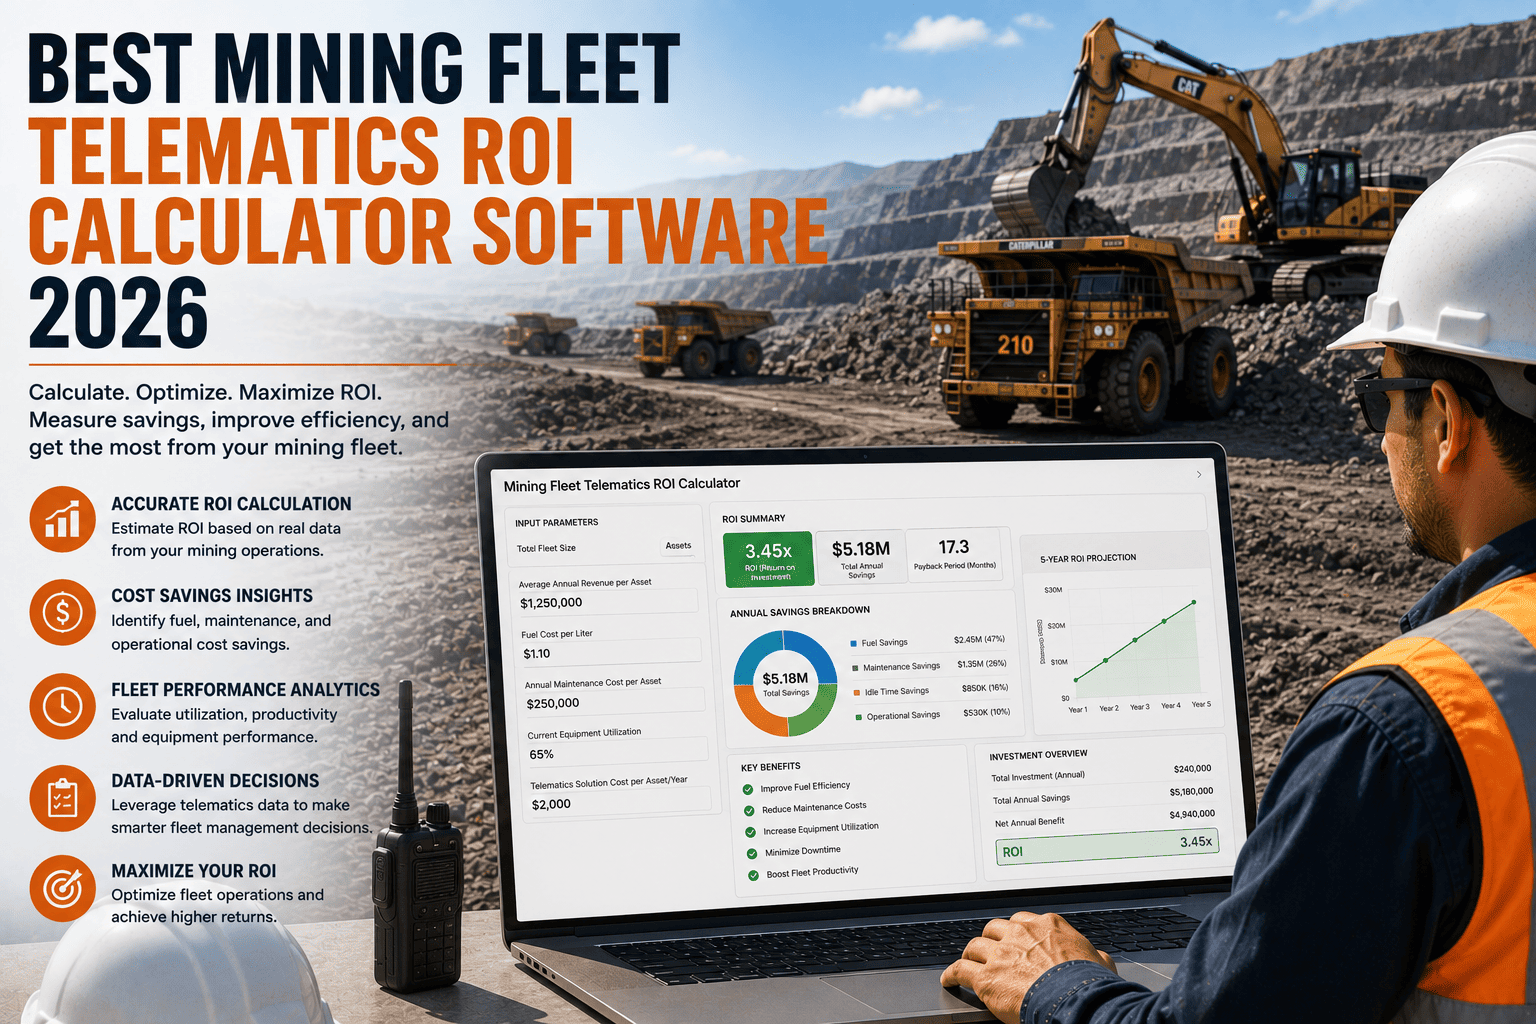
Ask a mine manager whether telematics works and you'll almost always get a yes. Ask them what it's actually worth in dollars, and the room usually goes quiet. That gap between believing something helps and knowing exactly how much it's worth is where most fleet technology budgets get stuck, questioned, or quietly cut during the next planning cycle. A mining fleet telematics ROI calculator closes that gap by turning fuel data, engine hours, maintenance records, and downtime logs into a single number finance actually trusts.
Mining fleets typically see 11 to 15 percent fuel efficiency gains, 16 to 25 percent lower maintenance costs, 35 to 40 percent longer tire life, and 10 to 20 percent higher uptime after adopting telematics, with a median payback period of 4.2 months and 200 to 500 percent first-year ROI. Sign up free to calculate what these numbers actually mean for your fleet.
Why Most Fleets Underestimate Their Own Telematics ROI
The reason ROI conversations stall isn't a lack of savings, it's a lack of measurement. Fuel waste from idling, tires replaced early because nobody tracked pressure or rotation, and maintenance done on guesswork instead of engine hours all bleed money in small, unremarkable amounts that never show up as a single line item. Nobody budgets a loss for "tires wore out four months early." It just happens, quietly, across every asset in the yard.
The Four Places Telematics ROI Actually Comes From
Every dollar a mining telematics platform saves lands in one of four buckets, and seeing them side by side is usually the first time a fleet manager realizes how much is stacking up.
Idle-time reduction and route optimization cut fuel consumption, typically the fastest savings category to show up.
Engine-hour based PM scheduling replaces guesswork, cutting emergency repair callouts and parts waste.
Pressure and load monitoring extends tire life significantly, a line item most fleets never track closely.
Predictive alerts catch developing failures before they become the 15,000-dollar-per-hour breakdown mines dread most.
FleetRabbit pulls fuel, maintenance, tire, and uptime data from your existing fleet into one dashboard, showing exactly where the savings are coming from instead of asking you to trust a vendor's average.
How to Calculate Your Own Telematics ROI
The math isn't complicated once you have the right inputs. It just requires pulling twelve months of real numbers instead of estimating from memory.
Document Your Baseline
Pull the last 12 months of fuel spend, maintenance costs, tire replacement frequency, and unplanned downtime hours for every asset.
Add Up Your Total Investment
Include the software subscription, hardware, installation, and the internal hours required to onboard and train your team.
Track Monthly Savings by Category
Watch idle-time reduction, prevented emergency repairs, extended tire life, and recovered uptime as they show up month over month.
Apply the ROI Formula
(Total Savings minus Total Investment) divided by Total Investment, multiplied by 100, gives you a percentage finance can act on.
Sample ROI Math: A 15-Truck Mining Operation
Numbers land better when they're tied to a real fleet size. Here's what the math typically looks like for a mid-size mining operation running 15 haul trucks, where unmanaged inefficiencies were quietly costing around 127,000 dollars a year before telematics.
| Savings Category | Typical Improvement | What Drives It |
|---|---|---|
| Fuel Consumption | 11 to 15 percent reduction | Idle alerts, route optimization, and driver behavior scoring |
| Maintenance Spend | 16 to 25 percent reduction | Engine-hour PM scheduling replacing calendar-based guesswork |
| Tire Replacement Cost | 35 to 40 percent life extension | Pressure monitoring and load tracking across every truck |
| Unplanned Downtime | 10 to 20 percent uptime gain | Predictive alerts catching developing failures early |
What the First Year Actually Looks Like
A comprehensive telematics and predictive maintenance program typically returns 200 to 500 percent on a first-year investment, and smaller fleets often see the higher end of that range, since one prevented breakdown on a 15,000-dollar-per-hour haul truck has an outsized impact on a tighter operating budget. The savings don't arrive all at once, though, which is exactly why tracking the timeline matters.
The Realistic Timeline to Breakeven
Setup and Baseline
Hardware installed, dashboards live, historical data starts flowing in for comparison.
First Fuel Savings Appear
Idle hotspots get flagged, and fuel savings are usually the first category to show measurable movement.
Median Breakeven Point
Most mining fleets recover their full telematics investment by this point, based on documented deployments.
Full ROI Realized
Maintenance costs trend down, tire life extends measurably, and the full 200 to 500 percent return comes into view.
If you'd rather see this modeled against your actual fleet size and asset mix instead of a generic example, you can book a free demo and walk through the numbers with our team directly.
FleetRabbit tracks fuel, maintenance, tire, and uptime data across your whole fleet so you can show finance an ROI figure built from your own numbers, not an industry brochure.
Frequently Asked Questions
FleetRabbit turns fuel, maintenance, tire, and uptime data from your existing mining fleet into a clear ROI figure, so every dollar spent on telematics can be measured against every dollar it saves.







