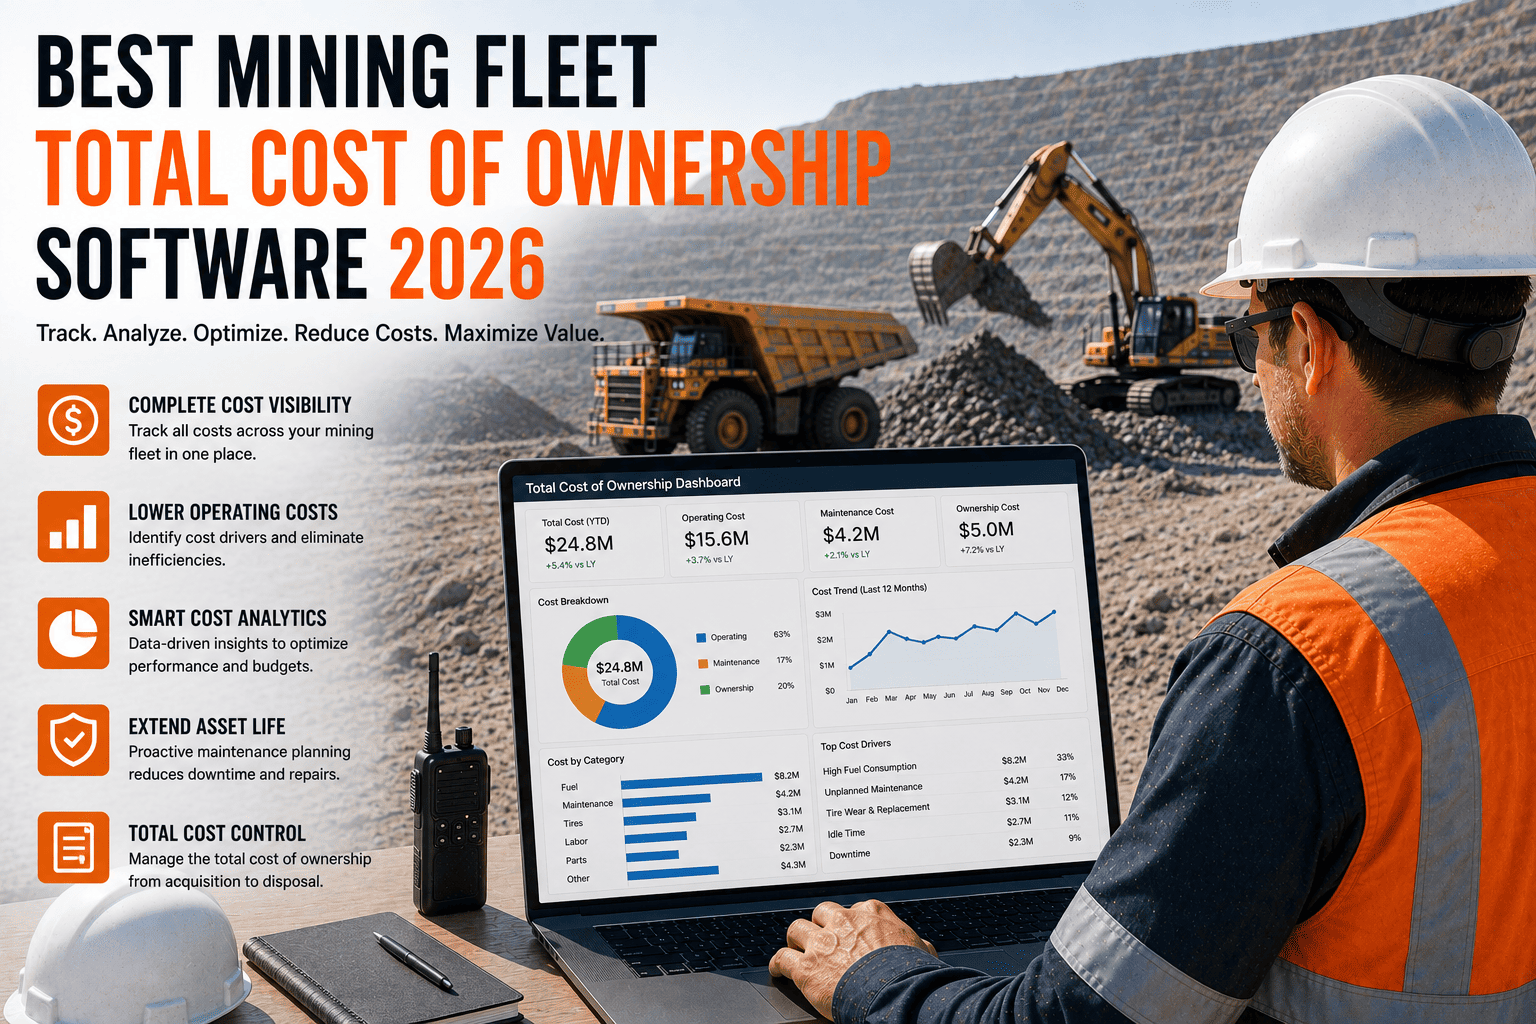
Two haul trucks sit side by side in a fleet manager's spreadsheet. One cost less to buy. Three years later, it has cost far more to own — swallowed by unplanned repairs, poor fuel efficiency, and downtime nobody budgeted for. Purchase price is the number everyone sees first and the number that misleads more mining fleet decisions than any other. Mining fleet total cost of ownership software exists to replace that guesswork with the real number.
Mining fleet TCO software tracks acquisition cost, fuel, maintenance, labor, downtime, and depreciation for every asset over its full lifecycle, then rolls it into a true cost-per-hour figure you can compare across machines and manufacturers. Acquisition price typically represents only 25 to 40 percent of an asset's total lifecycle cost, and operations that compare purchase price alone routinely spend 40 to 60 percent more over an asset's life than those who calculate TCO properly. FleetRabbit consolidates these cost streams automatically so fleet managers see the real number without building a spreadsheet from scratch.
What Total Cost of Ownership Actually Includes
TCO is not one number pulled from an invoice. It's every cost a piece of equipment generates from the day it arrives on site to the day it's sold, scrapped, or rebuilt.
Acquisition Cost
Purchase price, delivery, financing, and setup — typically only 25 to 40 percent of what an asset actually costs across its working life.
Fuel & Operating Cost
Fuel consumption, consumables, and operator labor, measured per engine hour rather than per mile for mining equipment.
Maintenance & Downtime
Scheduled service, unplanned repairs, and every hour of lost production while equipment sits idle waiting on parts or labor.
The TCO Formula Mining Fleets Should Be Using
Every credible TCO model comes down to the same underlying structure. The difference between a rough estimate and a decision-grade number is how completely each component is tracked.
| Cost Component | What It Captures | Common Blind Spot |
|---|---|---|
| Acquisition | Purchase price, delivery, financing cost, initial setup | Cost of capital is frequently left out entirely, even on cash purchases |
| Fuel & Consumables | Fuel burn per engine hour, filters, tires, fluids | Rarely tracked per asset, so poor-efficiency machines hide inside a fleet-wide average |
| Maintenance | Scheduled PM cost plus unplanned repair cost per incident | Emergency repair premiums get buried in a general repairs line instead of tied to one asset |
| Downtime | Lost production value for every hour an asset is unavailable | Almost never quantified in dollars, even though it often exceeds the repair bill itself |
| Depreciation & Residual | Value lost over the ownership period, offset by resale or trade-in value | Estimated once at purchase and never revisited as market conditions shift |
FleetRabbit pulls fuel, maintenance, and downtime data into one true cost-per-hour figure for every machine in your fleet. Sign up free to see your own fleet's real numbers, or book a demo to walk through a live TCO comparison.
Why Purchase Price Alone Is a Misleading Number
Acquisition cost is the easiest number to compare between two machines, which is exactly why it gets over-weighted in replacement decisions. The real cost of ownership lives almost entirely in what happens after the purchase order is signed.
The 25 to 40 Percent Problem
Across industrial equipment generally, acquisition cost represents only 25 to 40 percent of an asset's total lifecycle cost. The remaining 60 to 75 percent accumulates quietly through fuel, maintenance, and downtime — costs that rarely get compared side by side with the purchase decision that created them.
What this means in practice
A haul truck priced 10 percent lower at purchase can easily cost more overall if it burns more fuel per hour or requires more frequent unplanned repairs across its working life.
The Hidden Cost of Comparing on Price
Operations that select equipment or vendors based on purchase price alone routinely end up spending 40 to 60 percent more over the asset's lifetime than operations that model full TCO before deciding. That gap compounds across every truck, loader, and drill rig in a fleet.
What this means in practice
A fleet of 20 machines making price-only decisions can be carrying hundreds of thousands of dollars in avoidable lifetime cost without a single line item showing where it went.
Cost Per Hour: The Metric Mining Fleets Actually Need
Mining equipment runs on engine hours, not mileage, which means cost per mile — the standard metric in most fleet software — doesn't translate. A true mining TCO platform normalizes every cost stream to cost per engine hour instead, making machines of different ages, models, and duty cycles genuinely comparable.
Cost per hour also reveals decisions that a raw dollar total hides. A ten-year-old haul truck with a low current repair bill can still carry a high cost per hour once falling utilization is factored in, because the same fixed costs are being spread across fewer productive hours. Tracking this trend over time — not just the current month — is what turns TCO software from a reporting tool into a genuine repair-or-replace decision engine.
FleetRabbit normalizes fuel, maintenance, and downtime into a true cost-per-hour figure for every asset, so repair-or-replace decisions are based on data instead of a gut feeling. Start your free trial today, or book a 30-minute demo to see your own equipment modeled live.
Using TCO Data to Decide: Repair, Rebuild, or Replace
The entire point of tracking TCO per asset is to answer one recurring question with data instead of instinct: is this machine still worth keeping? Three signals from accurate TCO tracking answer it reliably.
Rising Cost Per Hour Trend
A machine whose cost per hour has climbed steadily over several quarters, even with no single dramatic repair, is quietly becoming more expensive to run than a replacement would be.
Maintenance Cost Crossing the Replacement Threshold
When cumulative repair spend on one asset approaches a meaningful share of its replacement cost, continuing to repair it stops being the obvious choice, even if the machine still runs.
Downtime Frequency, Not Just Duration
An asset breaking down often, even briefly each time, disrupts dispatch and utilization in ways a single long outage doesn't — and that pattern shows up clearly in per-asset TCO history long before it becomes an emergency.
Frequently Asked Questions
Purchase price is only the first quarter of what a machine will actually cost you. FleetRabbit tracks fuel, maintenance, and downtime automatically so every repair-or-replace decision is backed by a real cost-per-hour number.







