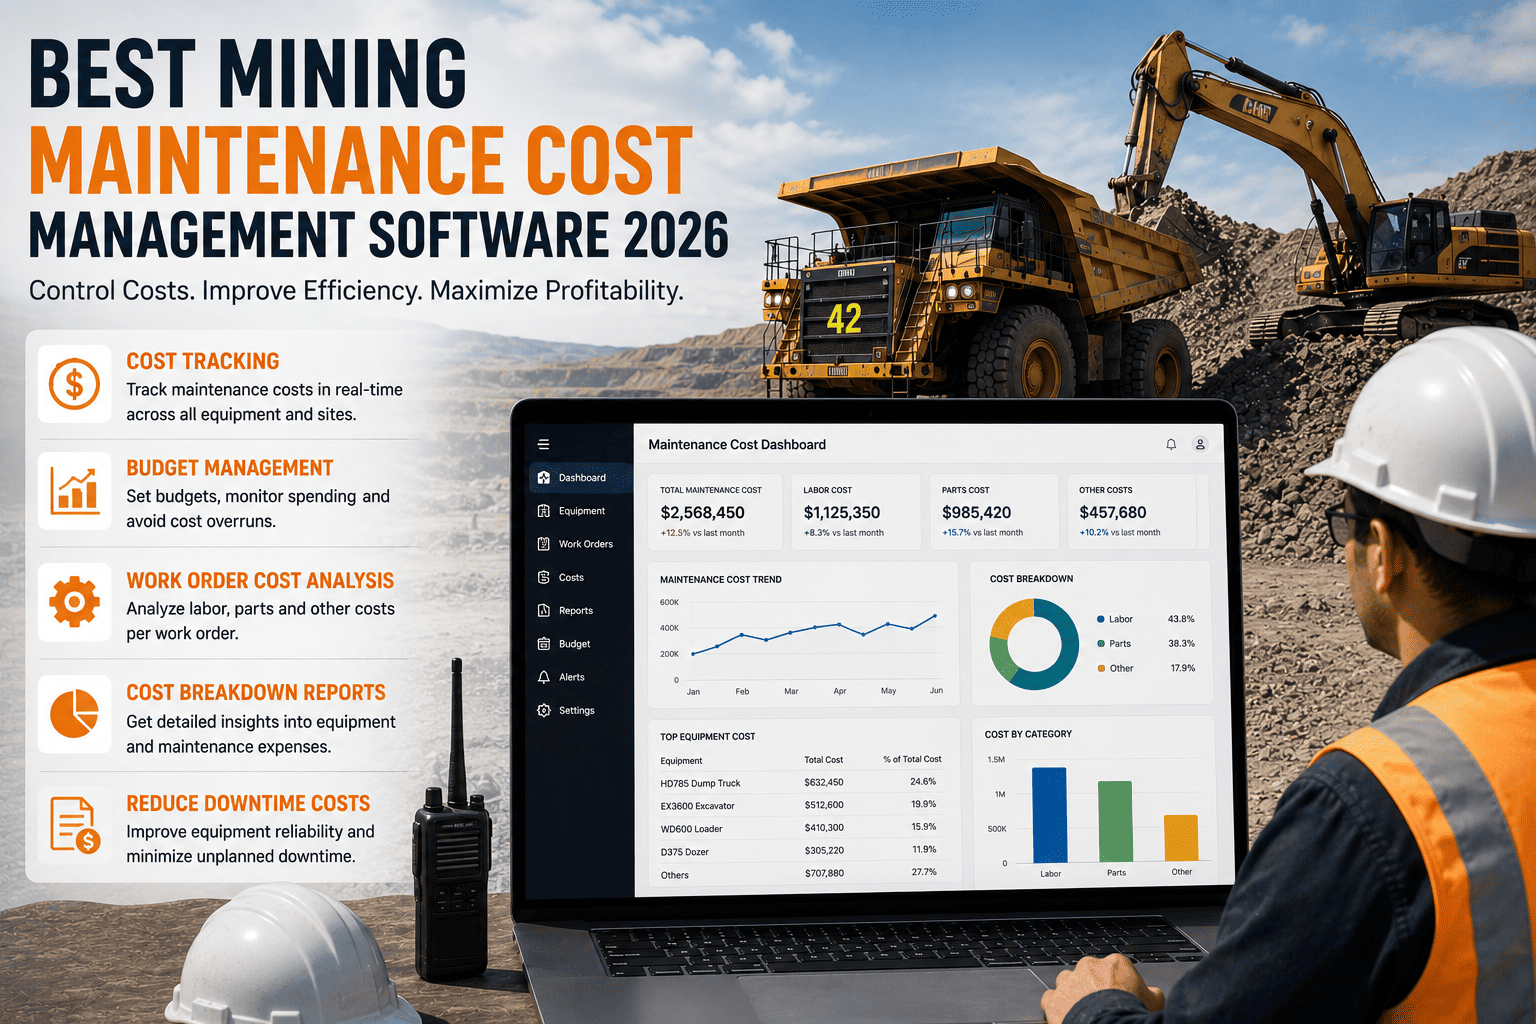
Ask most mine site managers what their maintenance budget actually buys and you will get a number, not an answer. Total spend for the quarter, sure. But which assets are quietly draining that budget month after month, which repairs are costing four times what they should because they keep happening unplanned, and whether this year's spend is trending toward a healthy fleet or a deferred-maintenance disaster, that picture rarely exists anywhere except in someone's head. Maintenance cost management software exists to replace that guesswork with numbers a budget meeting can actually be built around.
Why Maintenance Spend Is the Hardest Number to Pin Down
Maintenance cost is not one number. It is dozens of smaller numbers, labor hours, parts, contractor invoices, downtime losses, scattered across spreadsheets, accounting systems, and paper work orders that rarely talk to each other. By the time a finance report rolls up total spend at month end, the detail that would actually explain why costs moved is already gone.
The Metric That Actually Matters: Cost Per Operating Hour
A raw dollar total tells you almost nothing on its own. The number that actually drives decisions is maintenance cost per operating hour, because it lets you compare a haul truck running eighteen hours a day against one running six on equal footing. A machine that looks expensive on a monthly total might actually be your cheapest asset per hour worked, while a quiet, rarely-discussed unit could be bleeding money every time it runs.
The Core KPIs Every Mining Maintenance Budget Should Track
A handful of metrics, tracked consistently and tied back to real work order data, explain almost everything a fleet manager needs to know about whether maintenance spend is under control or quietly spiraling.
| Metric | What It Tells You | Healthy Target |
|---|---|---|
| Maintenance Cost Ratio | Total maintenance spend as a percent of asset replacement value | 2 to 6 percent annually |
| Planned vs Unplanned Ratio | Whether your program is proactive or stuck reacting to breakdowns | 80 percent or more planned work |
| Cost Per Operating Hour | True cost of running each asset, comparable across fleet size and usage | Trending flat or down over time |
| Mean Time Between Failures | Average runtime between unplanned breakdowns, by asset class | Increasing year over year |
Why a Falling Cost Per Tonne Can Be a Warning Sign
It is tempting to celebrate a falling unit cost, but a cost per tonne that drops because maintenance is being deferred is not an efficiency win, it is a liability building quietly in the background. Cost metrics only mean something when they are read alongside reliability metrics like uptime and mean time between failures, never in isolation.
The Trap of Measuring Spend Without Measuring Reliability
A maintenance budget that looks great on paper because spending dropped 15 percent year over year can be hiding a fleet that is quietly falling apart. The only way to tell the difference between genuine efficiency and dangerous deferral is tracking cost and reliability metrics side by side, on the same dashboard, updated from the same work order data.
What to Demand From a Cost Management Platform
Plenty of tools will show you a total spend chart. Far fewer connect that spend to the specific asset, work order, and failure mode that actually drove it, which is the difference between a report you read once and a tool that changes how budgeting decisions get made.
Cost Tied to the Specific Asset and Work Order
Every dollar spent should be traceable back to which machine, which repair, and whether it was planned or emergency, not buried in a generic monthly total.
Cost and Reliability on the Same View
Spend trends mean nothing without uptime and failure data sitting right next to them, so a falling cost line never gets mistaken for a win when it is actually deferral.
Automatic Planned vs Unplanned Split
The platform should classify every work order automatically, so the ratio that predicts your future repair costs is always current, not calculated once a quarter by hand.
Per-Asset and Fleet-Wide Roll-Up
A planner needs to drill from total fleet spend down to a single haul truck's cost history in a couple of clicks, not a separate spreadsheet pull for every level of detail.
The fastest way to know whether a platform actually delivers this is to see your own fleet's numbers inside it. You can sign up for a free trial and have your real cost-per-hour figures running within a day.
How FleetRabbit Turns Maintenance Spend Into a Decision Tool
FleetRabbit was built so that every dollar of maintenance spend lands exactly where it happened, tied to the asset, the work order, and whether the repair was planned or an emergency. Instead of waiting for a month-end report to explain what already happened, fleet managers see the trend forming in real time.
Cost Per Operating Hour, Calculated Automatically
FleetRabbit pulls labor, parts, and contractor costs straight from completed work orders and calculates true cost per operating hour for every asset, so comparing a high-utilization haul truck against a low-utilization support vehicle is finally an apples-to-apples conversation.
Planned and Unplanned Spend, Split Without the Manual Work
Every work order is automatically classified as planned or unplanned, keeping the ratio that predicts future repair costs current at all times instead of recalculated by hand once a quarter.
Reliability Sitting Right Beside the Cost Numbers
Uptime, mean time between failures, and cost per hour live on the same dashboard, so a falling spend trend never gets mistaken for an efficiency win when it is actually deferred maintenance building toward a bigger bill.
Stop Reading Maintenance Costs After the Fact
FleetRabbit connects every work order to its true cost and ties spend trends directly to reliability data, so your maintenance budget conversation runs on real numbers instead of a monthly total nobody can explain. Sign up for a free trial and see your fleet's cost per hour today, or book a demo to walk through your specific assets and budget on the call.
Building the Case for Better Cost Visibility
The financial argument for cost management software writes itself once a few real numbers are on the table. Unplanned downtime in mining can cost between 50,000 and 200,000 dollars per hour depending on the asset, and fleets where less than half of all maintenance work is planned see repair costs run two to five times higher than fleets with a disciplined planned-maintenance program.
Where the Real Budget Recovery Happens
Moving even a modest share of unplanned repairs into planned, scheduled work compounds quickly across a fleet, because each shift away from emergency labor rates and expedited parts pricing recovers real money. The bigger win is visibility itself: once a fleet manager can see exactly which assets are driving cost per hour upward, the next maintenance dollar gets spent on the problem that actually matters instead of whichever repair happened to be loudest that week.
Frequently Asked Questions
Your Maintenance Budget Already Has a Story to Tell
The data is sitting in your work orders right now. It just is not connected to the numbers that would explain it. FleetRabbit turns every repair into a tracked cost-per-hour figure tied to reliability, so your next budget conversation runs on evidence instead of a monthly total nobody can fully explain. Get started with a free trial or talk through your specific fleet and current spend with our team first.







