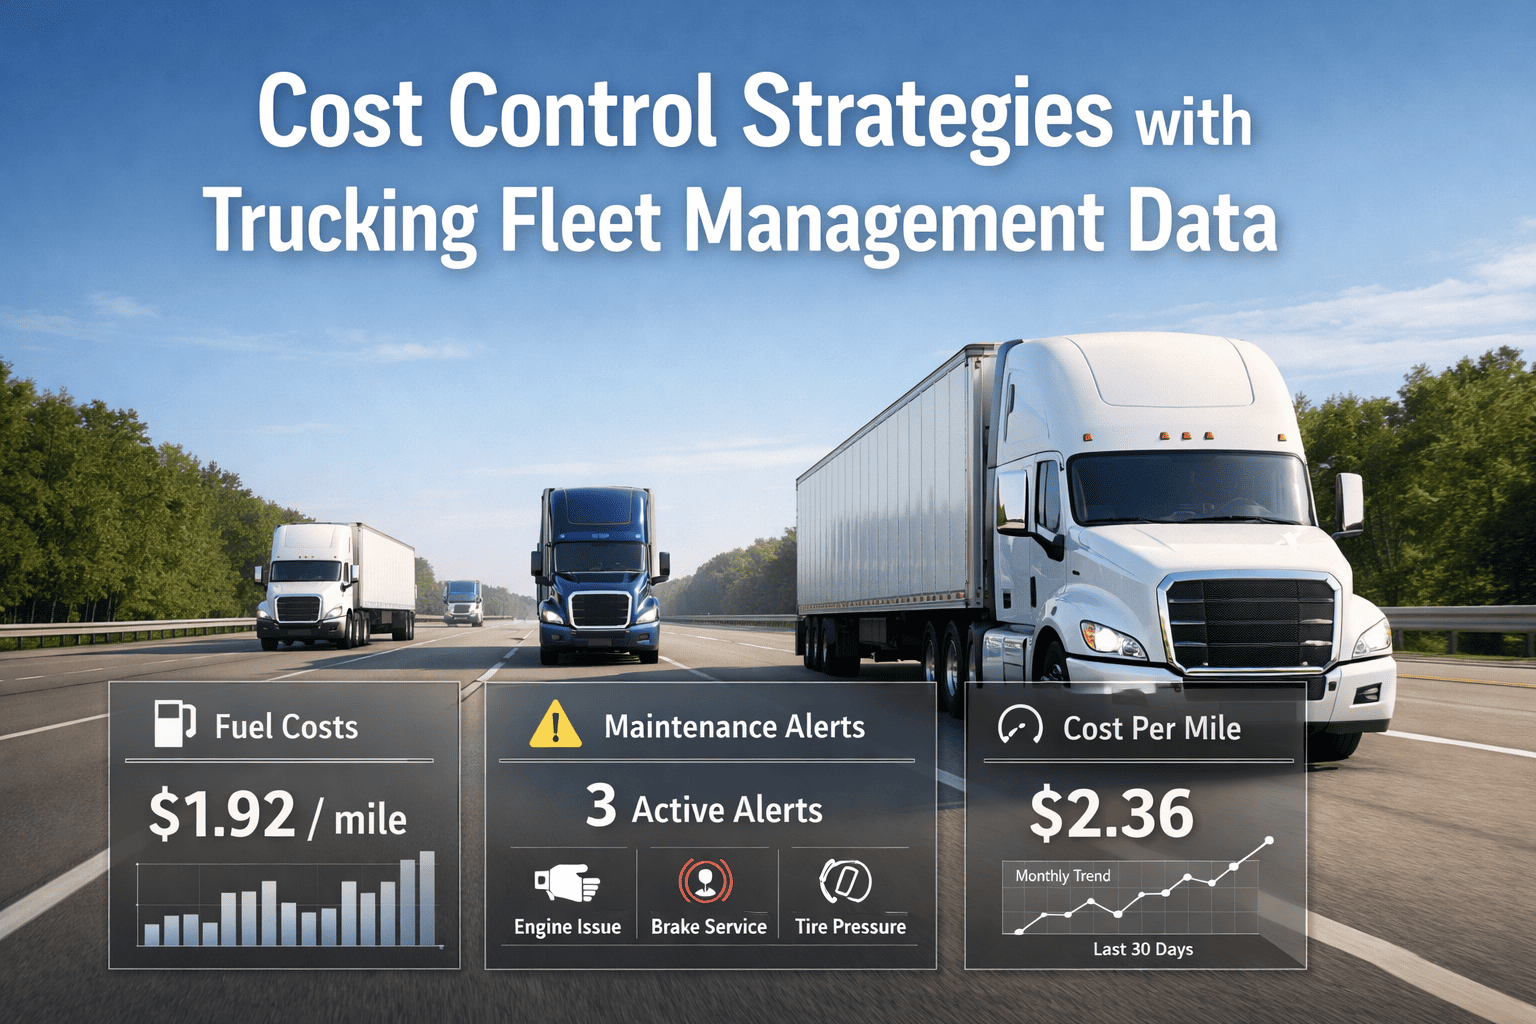
Uncontrolled operating costs are the silent profit killer in trucking and logistics. While fuel prices dominate headlines, fleet managers know that the real cost hemorrhage occurs across dozens of smaller line items — idle time, inefficient routing, unplanned maintenance, excessive overtime, and underutilized vehicles quietly consuming margin across every shift. FleetRabbit's fleet management platform gives transportation and logistics companies the real-time data infrastructure to identify, measure, and eliminate these cost drivers before they compound into serious financial damage. Book a free FleetRabbit demo to see cost control analytics in action.
Trucking fleets that implement data-driven cost management reduce total operating cost per mile by 12–22% within 90 days. FleetRabbit delivers real-time visibility into fuel consumption, maintenance spend, driver behavior, and route efficiency — giving fleet executives the exact data needed to reduce cost per mile, improve asset utilization, and protect margin in a high-pressure logistics environment.
The Real Cost Structure of a Trucking Fleet
Understanding where money actually leaves a fleet is the foundation of effective cost control. Most fleet executives track fuel spend and driver pay — but the highest-leverage cost reduction opportunities are often buried in the data that paper-based or siloed systems never surface. FleetRabbit consolidates all cost-relevant data into a single operational view, enabling precise identification of waste at the vehicle, driver, route, and fleet level.
Strategy 1 — Fuel Cost Reduction Through Behavior and Route Data
Fuel is the single largest controllable cost in a trucking operation. FleetRabbit tracks fuel consumption at the vehicle and driver level, correlating consumption data with driving behavior metrics — idling duration, speed patterns, hard acceleration, and fuel-inefficient routing — to pinpoint where fuel is being wasted and by whom.
- Idle time per vehicle per shift — fleet average vs. outliers
- Miles per gallon tracked by driver and by route segment
- Speed band compliance — percentage of miles at fuel-optimal speeds
- Fuel card transaction reconciliation against GPS-verified fill locations
- Engine-off compliance at loading docks and rest stops
- Harsh acceleration and braking events per trip
Excessive idling alone accounts for approximately 0.8 gallons of diesel per hour on a Class 8 truck. A 20-vehicle fleet averaging 45 minutes of unnecessary idle time per shift burns an estimated $12,000–$18,000 annually in idle fuel — before factoring accelerated engine wear and DOT hours-of-service implications. FleetRabbit's idle alerts notify drivers in real time and deliver supervisors daily idle reports segmented by driver and vehicle.
Strategy 2 — Maintenance Cost Control with Predictive Data
Reactive maintenance — fixing vehicles after they break — is the most expensive way to keep a fleet running. Unplanned breakdowns cost 3–5x more than scheduled maintenance in parts, labor, roadside assistance, and lost revenue from delayed loads. FleetRabbit shifts maintenance from reactive to predictive by continuously monitoring vehicle health data and integrating driver inspection reports into a proactive service schedule.
- Breakdown discovered by driver on road
- Emergency roadside service: $450–$900
- Tow to shop: $300–$800
- Expedited parts sourcing premium: 20–40%
- Load delay penalty or rebooking cost
- Driver overtime or reassignment cost
- Total unplanned event cost: $3,000–$8,000+
- Engine data flags early wear indicators
- DVIR defect triggers automatic work order
- Service scheduled during planned downtime
- Parts ordered in advance at standard cost
- Vehicle serviced before failure occurs
- Zero load disruption — zero emergency fees
- Total planned event cost: $400–$900
Strategy 3 — Cost Per Mile Tracking at the Fleet and Vehicle Level
Cost per mile (CPM) is the most critical performance metric in trucking — yet most fleet managers calculate it monthly at the aggregate level, making it nearly impossible to identify which vehicles, drivers, or routes are destroying margin. FleetRabbit calculates CPM in real time at every analytical dimension that matters.
Strategy 4 — Driver Overtime and Hours Optimization
Driver labor is the second-largest cost category in trucking, and overtime is one of its most avoidable components. Inefficient dispatching, poor load sequencing, and inadequate HOS planning drive excessive driver hours that translate directly to overtime premiums and potential FMCSA violations. FleetRabbit integrates ELD hours-of-service data with dispatch scheduling to optimize driver assignments before shifts begin.
Strategy 5 — Asset Utilization and Dead Mile Reduction
Every mile a truck runs empty is a direct cost with zero revenue return. Industry data indicates that trucking fleets average 15–22% empty miles — a figure that FleetRabbit's utilization analytics can significantly reduce by identifying backhaul opportunities, optimizing vehicle positioning, and eliminating wasteful repositioning runs.
FleetRabbit's Executive Cost Dashboard — Real-Time Visibility
Fleet executives and operations managers need cost visibility without pulling data from multiple disconnected systems. FleetRabbit's executive dashboard surfaces every critical cost metric in a single, real-time view — with the ability to drill down from fleet-wide summary to individual vehicle or driver within seconds.
Estimated ROI — 25-Vehicle Trucking Fleet
FleetRabbit provides fleet executives with a built-in ROI tracking module that measures cost savings against pre-deployment baselines — making it straightforward to quantify the financial return of the platform and communicate results to ownership or board-level stakeholders.
Frequently Asked Questions — Fleet Cost Control
From fuel waste to unplanned breakdowns to dead miles, FleetRabbit surfaces every hidden cost driver in your operation and gives you the tools to eliminate them — starting in your first 30 days on the platform.







