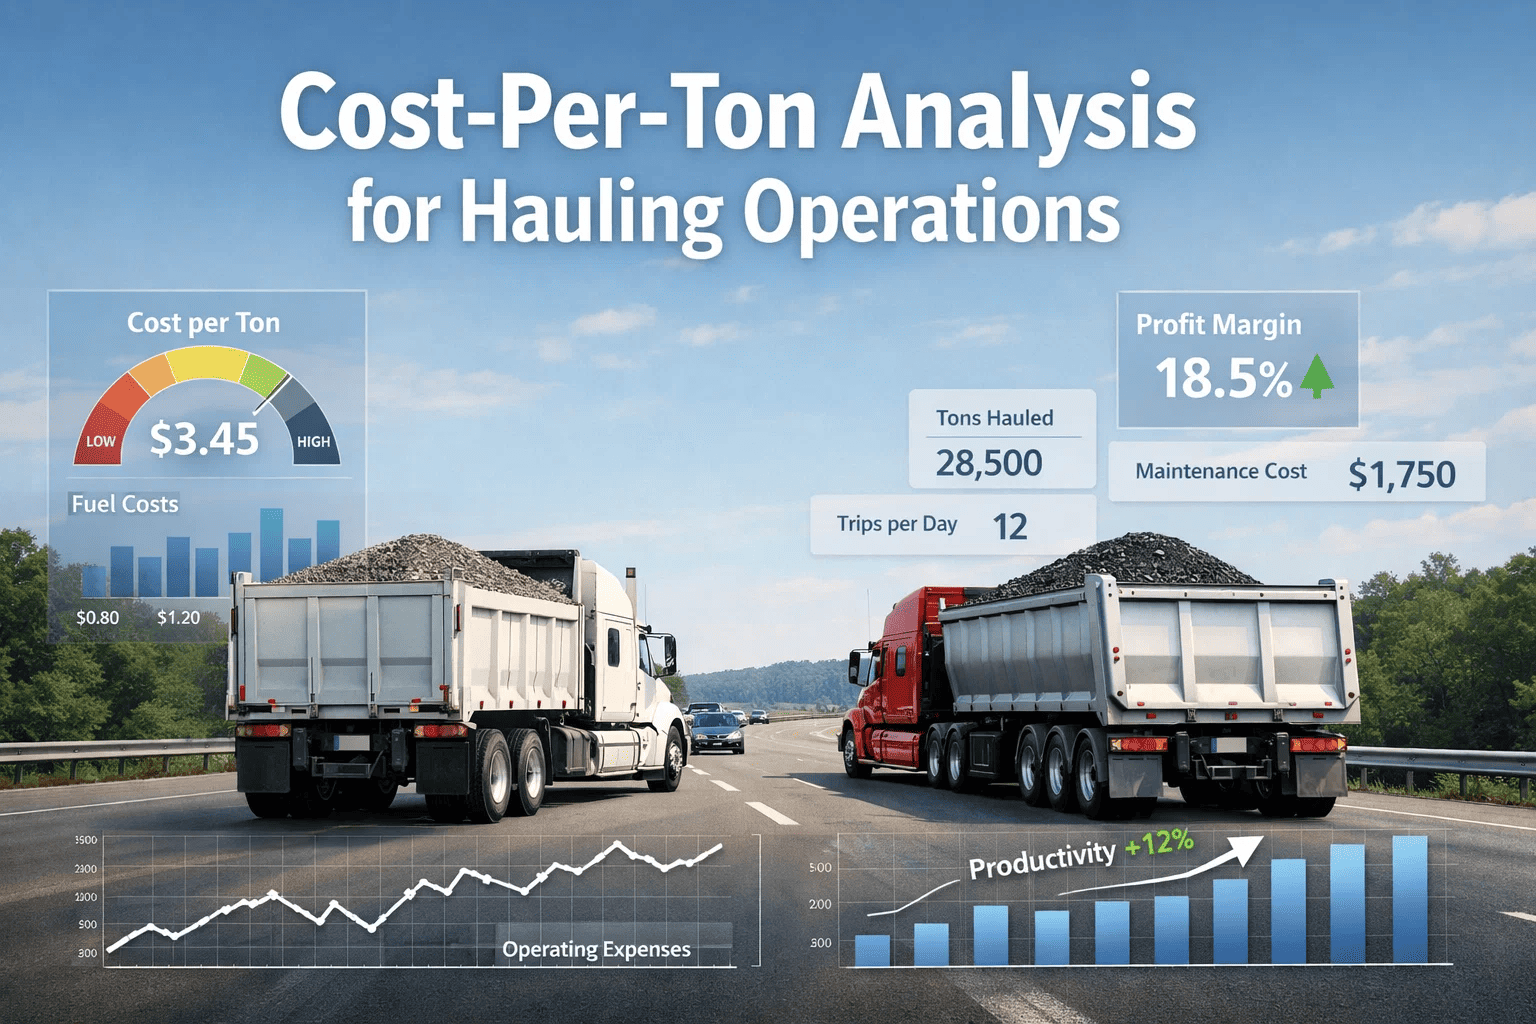
Cost-per-ton is one of the most operationally meaningful financial metrics available to hauling operations — yet it is among the least systematically tracked by the bulk material carriers, aggregate haulers, mining support operators, and construction material transporters who would benefit most from its analytical discipline. Unlike cost-per-mile metrics that are standard in general freight, cost-per-ton directly ties transportation expense to the productive output of the hauling operation — the actual material moved — making it the appropriate denominator for comparing efficiency across payload configurations, vehicle specifications, route profiles, and load-cycle optimization scenarios. A carrier hauling aggregate materials who reduces cost-per-ton by 8 percent while maintaining the same volume has generated an 8 percent margin improvement without adding a single truck, hiring a single driver, or winning additional contract volume. Book a demo to see how FleetRabbit's fleet cost analytics, maintenance management, and operational reporting capabilities support cost-per-ton tracking and optimization for hauling fleet operations.
Guide Summary
Cost-per-ton analysis provides hauling operations with the unit economics framework for comparing fleet performance across vehicles, routes, operators, and time periods in a manner that accounts for productivity variation — not just cost in isolation. This guide covers the cost components that constitute total operating cost in a hauling context, the payload data systems required to calculate accurate tons-hauled denominators, the specific analysis dimensions (vehicle-level, route-level, operator-level, period comparison) that generate actionable optimization intelligence, the common structural causes of elevated cost-per-ton, and how FleetRabbit's fleet management and cost tracking capabilities support the data infrastructure cost-per-ton analysis requires.
Cost Component Framework: Building the Complete Cost-Per-Ton Numerator
The accuracy of cost-per-ton analysis depends entirely on the completeness of the cost numerator — the total operating cost that is divided by tons hauled to produce the metric. Hauling operations that calculate cost-per-ton using only fuel and driver wages — the most visible variable costs — produce a metric that underestimates true cost by 35 to 50 percent after fixed costs, maintenance, depreciation, and overhead are properly allocated. Incomplete cost numerators produce cost-per-ton figures that appear favorable relative to true economics, leading to pricing decisions that are insufficient to cover actual cost, capital replacement decisions that are made based on understated vehicle economics, and operational comparisons that reward undercosting rather than genuine efficiency.
Building a complete cost-per-ton numerator requires establishing cost capture disciplines for each cost category — not just the categories that generate immediate invoices (fuel, tire purchases) but also the amortized costs that accumulate without generating obvious daily visibility (depreciation, major overhaul reserves, permit and license costs, insurance premium per operating day). FleetRabbit's work order system captures the maintenance and repair cost data that is otherwise the most difficult cost category to allocate accurately to specific vehicles — generating a per-vehicle maintenance cost record that allows accurate vehicle-level cost-per-ton comparison rather than fleet-average maintenance cost allocation that hides the disproportionate cost of aging vehicles.
Fuel
Largest variable cost — typically 28-35% of total. Includes diesel and DEF consumption. Track by vehicle and route using fuel card integration or ECM fuel burn rate from telematics.
Cost-Per-Ton Driver: Payload efficiency directly impacts fuel cost per ton — underloaded trucks carry the same fuel cost over fewer tons
Driver Wages and Benefits
Operator wages plus benefits — typically 18-25% of total. May be hourly, per-ton, or per-cycle depending on compensation structure. Overtime rate changes affect cost per ton in high-cycle-count periods.
Cost-Per-Ton Driver: Cycle time efficiency — idle time, queuing delay, and slow loading/unloading inflate labor cost per ton without adding payload
Tires
High variable expense in off-road and aggregate haul — 4-10% of total depending on road surface and haul profile. Track replacement events by vehicle in FleetRabbit work orders with per-tire cost and position for cost allocation accuracy.
Cost-Per-Ton Driver: Road surface and load weight are primary tire wear drivers — hauls over rough or sharp rock aggregate accelerate tire wear cost
Variable Maintenance (Filters, Fluids, Wear Parts)
Routine consumable maintenance — PM service parts, oil, filters, brake components. Captured in FleetRabbit PM work orders with parts cost attached to each vehicle's maintenance record for accurate vehicle-level allocation.
Cost-Per-Ton Driver: Accelerated PM interval requirements under heavy hauling duty cycle — aggregate haul PM intervals are shorter than highway truck intervals
Depreciation or Lease Payment
Capital cost of the vehicle — either depreciation schedule for owned equipment or monthly lease obligation. Allocate to cost-per-ton as daily depreciation charge times operating days. Vehicles with higher utilization (more tons per day) have lower depreciation per ton.
Cost-Per-Ton Driver: Utilization rate — vehicles parked for extended periods accumulate depreciation without hauling tons, inflating cost-per-ton
Insurance
Commercial auto, cargo, and liability insurance premiums. Allocate to vehicles as daily premium per unit — higher-risk or claims-history vehicles that carry surcharge rates increase their unit cost-per-ton versus clean-record fleet mates.
Cost-Per-Ton Driver: Accident and claims history affects premium rates — safety program investment in FleetRabbit reduces long-term insurance cost per ton
Major Overhaul Reserve
Accrual for major scheduled overhauls — engine rebuild, transmission overhaul, axle rebuild at high mileage intervals. Accrue per operating mile to normalize cost per ton over the vehicle's life rather than creating cost spikes at overhaul year. FleetRabbit maintenance history supports overhaul timing prediction.
Cost-Per-Ton Driver: Operations that don't accrue for major overhauls understate true cost per ton significantly — producing pricing decisions that are uneconomical over the vehicle's life
Overhead Allocation
Fleet management, administrative, facility, safety program, and technology costs allocated to hauling operations by appropriate cost driver — typically vehicle count or revenue. Included for total-cost analysis; omit for operational vehicle comparisons that measure controllable costs.
Cost-Per-Ton Driver: Fixed overhead cost per ton decreases as total tons hauled increases — overhead allocation economics favor high-utilization operations
Payload Data: The Denominator That Determines Everything
Cost-per-ton analysis is only as accurate as the payload data used to calculate the tons-hauled denominator. Hauling operations that estimate payload from truck capacity (assuming every load is a full payload) produce cost-per-ton figures that are systematically understated — because actual payload is almost always less than theoretical maximum capacity due to load density variation, receiver weight limitations, regulatory weight limits on mixed route types, and practical loading efficiency constraints. The gap between theoretical capacity cost-per-ton and actual capacity cost-per-ton is directionally unfavorable and quantitatively significant in most real-world hauling operations.
Accurate payload data requires integration of one of three measurement systems into the hauling operation's cost tracking workflow: onboard weighing systems that measure actual payload per load cycle from load cell or air suspension sensors integrated with the truck; pit-scale or mine-scale weight tickets that document payload for each load at the loading facility; or certified weigh station records for regulated material hauls where regulatory weight compliance requires formal measurement. FleetRabbit's load documentation capability allows payload records — whether from onboard weighing system integration or manual scale ticket data entry by drivers at loading sites — to be captured per load cycle and aggregated for cost-per-ton calculation alongside the maintenance cost and fuel consumption data that FleetRabbit tracks at the vehicle level.
Onboard Weighing System
Accuracy: High — Cycle-Level Measurement
Load cells integrated with suspension — measures payload for each load cycle at loading site before departure. Payload data transmitted to fleet management platform via telematics.
Best For: High-cycle operations where scale ticket processing is not practical — quarry and mine production operations with 50+ cycles per day
Limitation: Calibration maintenance required — onboard systems drift without periodic calibration against certified static scales
Facility Scale and Ticket Record
Accuracy: High — Certified Measurement
Certified truck scales at loading facility weigh each loaded truck before departure. Scale ticket documents load weight, material, date, and vehicle ID. Driver enters scale ticket data in FleetRabbit mobile app at loading site.
Best For: Standard aggregate, bulk commodity, and construction material hauling where loading facility has certified scale infrastructure
Limitation: Requires driver discipline in scale ticket data entry — gaps in data entry create denominator gaps in cost-per-ton calculation
Regulatory Weigh Station Records
Accuracy: Moderate — Sample-Based
Weigh station records document gross vehicle weight — payload derived by subtracting tare weight. Records available from regulatory agencies for compliance disputes but not systematically available for operational analytics.
Best For: Supplementary data for specific loads — not sufficient as primary payload measurement system for cost-per-ton analytics
Limitation: Incomplete coverage — most loads are not weighed at regulated stations. Not suitable as primary payload data source.
GPS Distance and Load Count Estimation
Accuracy: Low — Estimation Only
Estimating payload from GPS round trips (geofence events at loading and dumping sites) and assumed average payload per cycle. Establishes lower-fidelity cost-per-ton for operations without weight measurement infrastructure.
Best For: Initial cost-per-ton program launch before measurement infrastructure is in place — directionally useful, not precise enough for financial analysis
Limitation: Actual payload variation from cycle to cycle is typically 15-25% — average estimation introduces material error into cost-per-ton calculations
Cost-Per-Ton Analysis Dimensions: Where to Find Optimization Opportunities
A single fleet-average cost-per-ton figure is a lagging indicator — it tells a hauling operation what its aggregate performance was in a period, but it does not identify where the performance gap lies or what specific operational changes would produce improvement. The analytical value of cost-per-ton emerges from disaggregating the metric across dimensions that reveal variation — because variation between vehicles, routes, operators, or time periods identifies the specific performance differentials that management can investigate and act on.
Vehicle-Level Analysis
Calculate cost-per-ton separately for each truck in the fleet — using vehicle-specific fuel consumption from telematics, maintenance cost from FleetRabbit work orders, and payload from load records — over a consistent time period (monthly or quarterly).
What Vehicle-Level Analysis Reveals
High-cost-per-ton vehicles that are mechanically degraded — aging trucks with elevated maintenance costs requiring replacement planning
Fuel-inefficient vehicles that consume disproportionate fuel per ton due to engine tune issues, tire condition, or aerodynamic configuration
Low-payload-factor vehicles that consistently haul below capacity — identifying load assignment or operational practices that underload specific trucks
Route-Level Analysis
Calculate cost-per-ton by haul route — comparing the economics of shorter-distance high-cycle routes against longer-distance lower-cycle routes, off-road versus highway segments, and seasonal road condition impacts on maintenance cost per ton.
What Route-Level Analysis Reveals
Routes with unfavorable cost-per-ton that cannot be improved operationally — providing data basis for contract rate renegotiation
Road surface impacts on tire wear and suspension maintenance that represent route-specific cost components above fleet average
Optimal vehicle assignment — matching vehicle specification (dump capacity, off-road capability) to route requirements based on route-level cost evidence
Operator-Level Analysis
Calculate cost-per-ton attributable to specific operators — combining fuel consumption behavior (from telematics driver ID), cycle count per shift (from GPS load cycle tracking), and any incident-related costs attributable to identified operators over a fair time horizon.
What Operator-Level Analysis Reveals
Operators whose fuel efficiency behavior inflates per-ton fuel cost — target for coaching on throttle management and cycle speed optimization
Operators with significantly different cycle count productivity — identifying best-practice cycle management for knowledge sharing
Operators whose aggressive operation accelerates tire and brake component wear — reducing maintenance cost allocation requires behavior change
Period Comparison Analysis
Track cost-per-ton over consecutive periods — month-over-month and year-over-year — to identify seasonal effects, fuel price impact normalized for volume, and the measurable outcome of operational improvements implemented in specific periods.
What Period Analysis Reveals
Seasonal cost-per-ton patterns — winter road maintenance cost increases, summer fuel efficiency impacts from air conditioning load, spring mud season tire and maintenance cost spikes
Measured impact of operational changes — whether a PM program improvement, driver coaching initiative, or route optimization produced verifiable cost-per-ton improvement in subsequent periods
Fuel price exposure analysis — separating fuel price effects from operational efficiency effects in period-over-period cost-per-ton changes
Build the Fleet Cost Data Infrastructure That Cost-Per-Ton Analysis Requires
FleetRabbit's maintenance work order cost tracking, vehicle-level expense records, and operations analytics give hauling fleet managers the cost data foundation for vehicle-level, route-level, and period comparison cost-per-ton analysis that identifies specific optimization opportunities. Book a demo to review FleetRabbit's cost tracking capabilities for hauling operations.
Payload Factor Optimization: The Fastest Route to Cost-Per-Ton Improvement
Payload factor — the ratio of actual payload carried to the vehicle's maximum legal or practical payload capacity — is the operational variable that most directly affects cost-per-ton in hauling operations without requiring capital investment. A truck carrying 18 tons per cycle on a vehicle capable of 22 tons is generating 22 percent more cost-per-ton than its theoretical capacity would allow — because fuel, driver time, depreciation, and maintenance cost are committed for the cycle regardless of whether the truck is carrying 18 or 22 tons. Improving payload factor from 82 percent to 95 percent of capacity on that vehicle reduces cost-per-ton by approximately 14 percent on all costs that are fixed per cycle — a significant improvement available through loading practice optimization without changing routes, drivers, or equipment.
Payload factor analysis requires payload measurement data at the load cycle level — either from onboard weighing systems or facility scale tickets entered in FleetRabbit's load record at each load cycle. FleetRabbit's operations data allows fleet managers to calculate average payload factor by vehicle, by operator, and by loading location — identifying which loading sites, operators, or time-of-shift patterns are associated with systematically low payload factors that represent recoverable cost-per-ton opportunity. Loading site supervisors who see payload factor data for their facility compared to other loading locations have a performance indicator they can act on without requiring fleet management intervention at the loading face.
Low Loader Accuracy
Loader operators placing material below target payload weight to avoid risk of overloading — conservative load placement creates systematic under-utilization
Intervention
Real-time onboard weight display in-cab allows operator and loader to converge on target payload — feedback at each cycle guides loader to full utilization without overloading risk. Target payload range communicated to loader operators: for example, target 21.5-22 tons on a 22-ton rated dump — achieves high payload factor while maintaining weight compliance buffer.
Material Density Variation
Volumetric loading (loading to box capacity) combined with density-variable material produces highly variable payload weights — wet aggregate is denser than dry, river rock is less dense than crushed stone
Intervention
Track payload by material type in FleetRabbit load records — calculate average payload factor by material category. If specific materials consistently produce low payload factors from volumetric loading, evaluate heaped loading protocol for denser materials and rounded loading for lighter material to optimize across density variation. Some materials require weight-based loading regardless of box volume to achieve consistent payload factor.
Regulatory Weight Constraints
Mixed route profiles that include weight-restricted roads or bridges require trucks to be loaded below maximum capacity for sections of the haul to maintain compliance throughout the route
Intervention
Route-specific payload limits documented in FleetRabbit dispatch records — operators loading for weight-restricted routes given specific payload targets that represent the true maximum for their route's limiting restriction. Routes with significant weight restriction payload penalties evaluated for alternative routing that allows higher payload factor even at longer distance, if cost-per-ton economics favor distance over restriction.
Truck Availability and Scheduling Pressure
Loading sites under time pressure to maximize cycle count — rush loading that prioritizes cycle time over accurate payload targeting produces consistent under-loading to avoid the time cost of loader adjustment and reloading
Intervention
Quantify the payload factor versus cycle count trade-off for the specific operation — in most situations, a 2 percent reduction in cycle count that produces a 10 percent improvement in payload factor generates better cost-per-ton than cycle-count maximization with under-loading. FleetRabbit cycle data and payload data allows this trade-off to be calculated objectively for your specific operation's economics.
Contract Pricing and Cost-Per-Ton: Using Analytics for Commercial Advantage
Hauling contractors who know their actual cost-per-ton — disaggregated by route, material, and operating condition — have a substantial commercial advantage over competitors who price from intuition and industry rule-of-thumb. The contractor who can bid specific lane rates that genuinely reflect route economics — covering true cost including maintenance, overhaul reserves, and overhead allocation while preserving target margin — prices at a level they can sustain. The competitor who underbids based on incomplete cost understanding prices themselves into contracts they cannot fulfill at adequate margin without eventually either declining renewal or degrading service quality to stay profitable.
FleetRabbit's cost tracking across maintenance, fuel, and vehicle utilization provides the data foundation for cost-per-ton-based contract pricing models. When bidding a new haul contract — a specific material, specific origin-destination arc, specified payload weight, and estimated annual volume — a carrier with FleetRabbit cost data can model the specific route cost profile against historical comparable routes in their operations, estimate maintenance cost from comparable route and material profiles, and price the contract at a rate that covers verified cost with transparent margin rather than approximated cost with unknown margin. This analytical discipline compounds over time as the cost database builds — carriers with 3 to 5 years of route-specific cost data price new contracts with materially more precision than carriers without this analytical history.
Frequently Asked Questions
QHow do cycle time improvements affect cost-per-ton, and what are the primary cycle time variables that hauling operations can control?
Cycle time directly affects cost-per-ton through two mechanisms: labor cost per cycle (shorter cycles enable more cycles per shift, reducing labor cost per ton when drivers are paid hourly) and depreciation and fixed cost per cycle (more cycles per day spread fixed costs over more tons, reducing fixed cost per ton). For a fleet where fixed and labor costs represent 50 percent of total cost, a 15 percent improvement in cycle time that results in a proportional increase in cycles per shift reduces fixed and labor cost-per-ton by approximately 7.5 percent of total cost — meaningful improvement without equipment or personnel changes. The cycle time components that hauling operations can control most directly are: queuing time at the loading face — excavator availability, loading queue management, and scheduled loading windows; travel speed between loading and dumping sites — road surface condition, legal speed, driver behavior; dumping cycle time at the receiver — dumping facility capacity, dump-and-go protocols versus tailgate-timed discharge; and return travel speed — empty return speed adjustment within safety bounds where road and legal conditions allow. Poorly maintained roads between loading and dumping sites are a frequent cycle time drag — the maintenance cost of road upkeep is typically recovered many times over in cycle time improvement for high-cycle-count operations. FleetRabbit GPS data provides the cycle time decomposition analysis (time at loading, travel loaded, time at dump, travel empty) that identifies which cycle time component offers the largest improvement opportunity for your specific operation.
Book a demo to review how FleetRabbit's GPS data and operations analytics support cycle time analysis for your hauling fleet.
QWhat is the appropriate time period for calculating cost-per-ton, and how do seasonal variations affect the metric?
The optimal cost-per-ton calculation period balances statistical robustness (enough cycles to smooth out random variation) with operational relevance (short enough to detect emerging trends before they become entrenched problems). Monthly cost-per-ton provides the most actionable reporting frequency for operational management — monthly figures are available quickly enough after period end to act on and are based on enough cycles to be statistically meaningful for fleets operating 20 or more cycles per truck per month. Quarterly and annual cost-per-ton figures are appropriate for contract bidding, capital planning, and year-over-year performance comparison. Seasonal variation affects cost-per-ton through multiple mechanisms: winter road maintenance adds fuel and tire cost; seasonal material demand (spring construction ramp-up, fall harvest) concentrates volume into shorter periods, affecting fixed cost allocation per ton; fuel prices vary seasonally; and weather-related downtime changes the operating day denominator against which fixed costs are allocated. For accurate year-over-year comparison, track cost-per-ton by the same calendar periods — January through January — rather than rolling 12-month averages, which can obscure seasonal improvement or deterioration by blending period-specific conditions across rolling windows.
QWhat fleet management and vehicle specification changes have the largest impact on long-term cost-per-ton reduction for bulk hauling operations?
The vehicle specification and fleet management changes with the largest long-term cost-per-ton impact, ranked by typical magnitude of effect, are: Right-sizing vehicle payload capacity for the specific haul — operating vehicles with payload capacity matched to the typical tonnage available at the loading site avoids underloaded high-capacity vehicles or capacity-constrained cycles that limit achievable payload; maintaining optimal vehicle age mix — operating vehicles beyond their economic life inflates maintenance cost per ton faster than depreciation accrual assumptions capture, while over-frequent replacement saddles the fleet with premium depreciation on new equipment; tire specification optimization — selecting tire compounds and constructions specifically engineered for the road surface and load conditions of the operation rather than using highway tire specifications on aggregate haul duty cycles; and preventive maintenance program discipline — deferred maintenance in hauling operations typically generates 3 to 4 times the deferred maintenance cost in downstream repair, while a well-executed PM program maintains fuel efficiency, reduces breakdown-related cycle time loss, and extends component life in proportion to its consistent execution. FleetRabbit's maintenance cost tracking by vehicle quantifies the cost-per-ton impact of maintenance program quality directly — comparing actual maintenance cost per ton across vehicles with different PM compliance histories reveals the ROI of maintenance program investment in terms that capital decision makers can directly evaluate.
Implement Cost-Per-Ton Analytics in Your Hauling Operation — Starting with the Data FleetRabbit Already Tracks
FleetRabbit's vehicle-level maintenance cost tracking, work order records, and operations analytics provide the cost numerator data that cost-per-ton analysis requires — enabling hauling fleet managers to identify the specific vehicles, routes, and operators where optimization investment delivers measurable cost-per-ton improvement.
Vehicle Cost Tracking
Maintenance Cost Allocation
Cycle Analytics
Payload Factor Monitoring
Route Cost Benchmarking
Capital Planning Data
April 21, 2026
By Jason Smith
All Posts