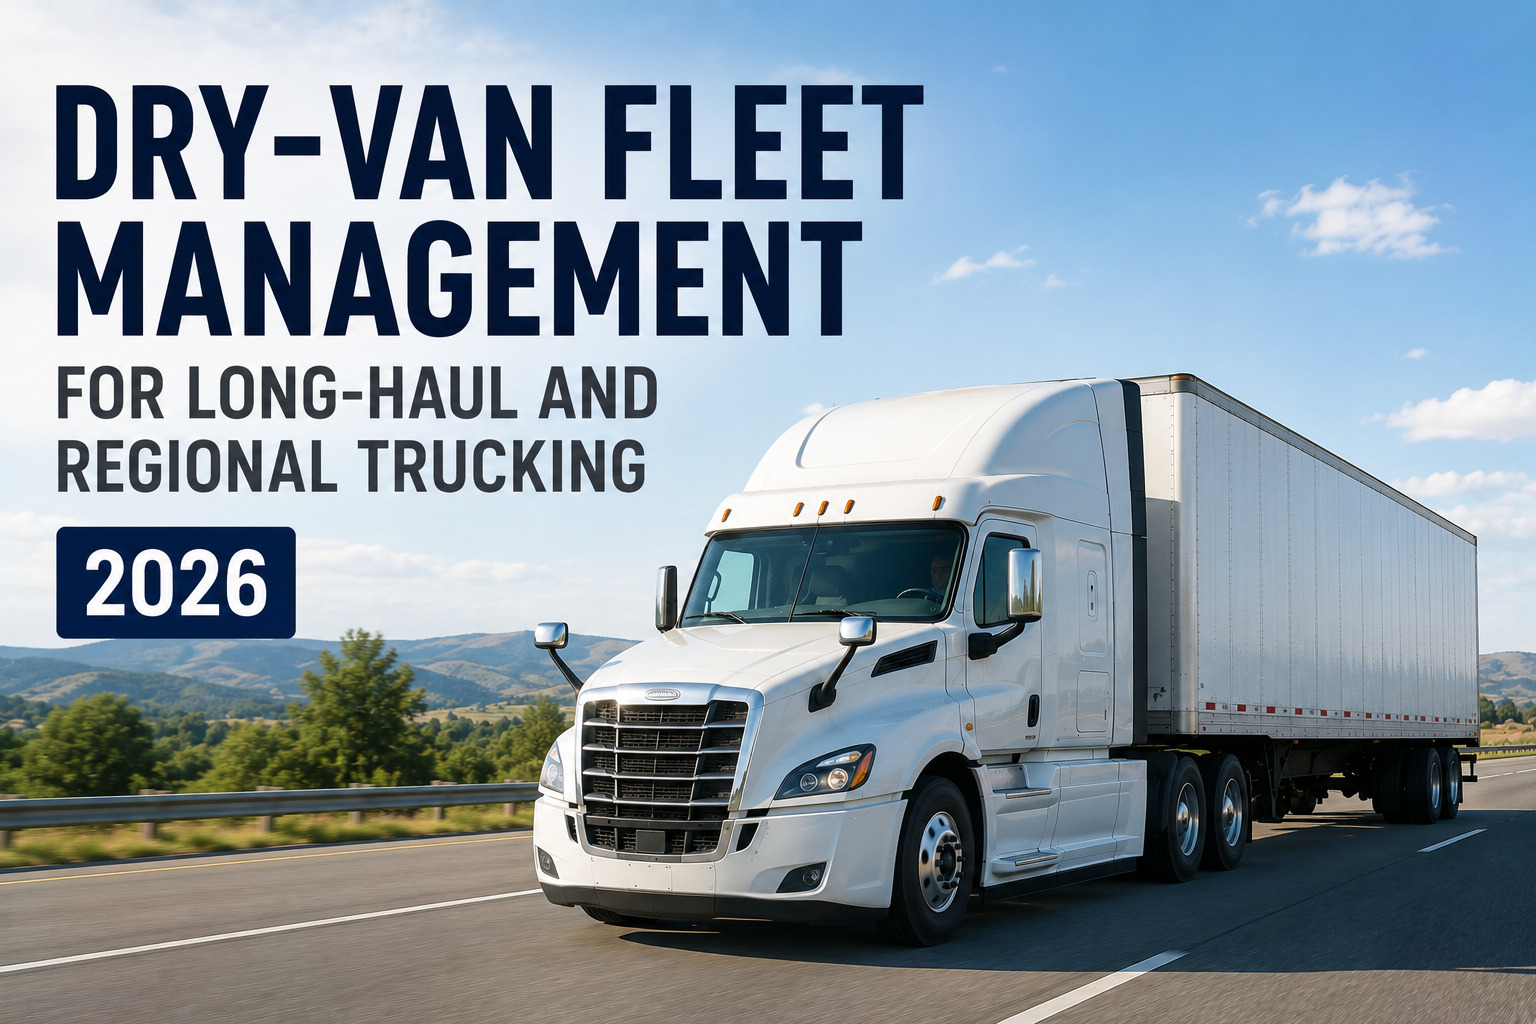
Dry van trucking is the backbone of American freight — responsible for moving everything from consumer goods and retail merchandise to manufacturing components and packaged food across the country. With the U.S. long-distance freight trucking industry valued at $226.5 billion in 2026, the stakes for fleet managers operating dry van fleets have never been higher. Yet despite its central role in the supply chain, dry van fleet management remains one of the most underoptimized disciplines in trucking. Thin margins, rising operating costs, driver retention pressures, and tightening capacity create an environment where the difference between profitability and loss is often measured in fractions of a cent per mile. This guide covers everything fleet managers need to know to run a high-performance dry van operation in 2026 — from cost-per-mile fundamentals to trailer utilization strategies and the technology that ties it all together. If you are ready to start now, sign up for FleetRabbit or book a demo and see how leading fleets are pulling ahead.
Dry Van Fleet Management for Long-Haul and Regional Trucking
In 2026's tight-margin freight environment, the fleets that win are not the ones with the most trucks — they are the ones that manage every mile, every trailer, and every maintenance interval with precision. Here is how to do it.
Dry van fleets operating in 2026 face a market where operating costs average $2.26 per mile while spot rates hover near $2.47 to $2.68 per mile nationally — leaving margins under 20 cents per mile for many carriers. Fuel accounts for 30 to 40 percent of total operating cost, making route optimization and idle reduction mission-critical. Fleets that track cost per mile in real time, maintain trailer utilization above 85 percent, and implement predictive maintenance schedules reduce overall operating costs by 12 to 18 percent annually.
What Is Dry Van Fleet Management and Why It Matters in 2026
Dry van fleet management is the operational discipline of coordinating tractors, 53-foot enclosed trailers, drivers, loads, and maintenance schedules to maximize revenue per mile while minimizing cost per mile. It encompasses every decision from load selection and lane strategy to driver scheduling, trailer tracking, fuel management, and compliance monitoring.
In 2026, this discipline matters more than ever. The truckload sector posted a negative 2.3 percent average operating margin in 2024, with many carriers still operating near breakeven heading into 2026. Dry van spot rates averaged $2.68 per mile nationally in April 2026 — up 6.3 percent month over month — but operating costs continue to rise in parallel. Equipment costs rose 3.8 percent in 2024. Insurance premiums are climbing. Driver wages remain competitive. For fleet managers who do not have a systematic approach to managing cost per mile, trailer utilization, and preventive maintenance, profitability becomes nearly impossible to sustain.
Long-Haul vs. Regional Dry Van: Key Differences
The 2026 Dry Van Cost-Per-Mile Reality
No metric matters more to a dry van fleet manager than cost per mile. It is the lens through which every operational decision should be evaluated. Understanding exactly where your costs originate — and how they compare to industry benchmarks — is the first step toward protecting your margin. Sign up for FleetRabbit to start tracking cost per mile automatically across your entire fleet.
Where Your Operating Costs Go
Track Every Cent Per Mile. Protect Every Margin.
FleetRabbit gives dry van fleet managers automatic cost-per-mile tracking, fuel efficiency monitoring, trailer utilization dashboards, and predictive maintenance alerts — all in one platform. Stop discovering cost problems on your monthly P&L. Catch them in real time and fix them before they compound. Book a demo to see a live walkthrough built for your operation.
Core Pillars of High-Performance Dry Van Fleet Management
Running a profitable dry van fleet in 2026 requires mastery across six interconnected operational areas. Weakness in any one area bleeds into the others — a breakdown on the road costs you in downtime, emergency repair premiums, missed deliveries, and driver dissatisfaction simultaneously.
Fuel Management and Efficiency
Fuel accounts for 30 to 40 percent of total operating cost — making it the single largest lever in dry van profitability. Speed management alone can save over $5,000 per truck annually. Every mile per hour above 55 MPH costs approximately 0.1 miles per gallon. On a 100,000-mile annual run, that difference compounds into tens of thousands of dollars across a fleet.
Fuel Efficiency Best Practices
- Monitor and limit highway speeds — cruise control set to 55–60 MPH saves 0.5–1.0 MPG versus unrestricted driving
- Track idle time per truck — one hour of idling burns approximately one gallon of diesel
- Enforce smooth acceleration and deceleration — aggressive driving increases fuel burn by 5 to 15 percent
- Maintain proper tire inflation — 10 PSI underinflation increases fuel consumption by 0.5 to 1 percent per tire
- Optimize fuel stop locations along routes — avoid buying fuel in high-tax states when cheaper alternatives are nearby
Trailer Utilization and Asset Management
For dry van fleets, trailers are the most undermanaged asset. A 53-foot trailer sitting at a shipper dock or staging yard earns nothing — but it still depreciates, accumulates per diem risk, and blocks capacity from other loads. High-performing dry van fleets target trailer utilization rates above 85 percent and actively track every trailer's location, status, and dwell time in real time.
Trailer Utilization Metrics to Track
Trailers sitting idle for more than 24 hours at a customer facility are a warning sign. They represent capacity you are not using and detention risk you are not managing. FleetRabbit's trailer tracking gives dispatchers real-time visibility into every trailer's location and time-on-site so no asset goes dark.
Preventive Maintenance Scheduling
A dry van truck breaking down on the road is not just a repair bill — it is a cascading operational crisis. Emergency roadside repairs cost 3 to 5 times more than planned maintenance for the same components. They strand drivers, force emergency towing, miss delivery appointments, and can damage customer relationships permanently. The solution is a proactive maintenance program built around mileage intervals, engine hours, and predictive diagnostics.
Maintenance by the Numbers
| Component | Planned Cost | Emergency Cost | Premium Paid |
|---|---|---|---|
| Brake System Service | $600 – $1,200 | $2,400 – $4,000 | 3–4x more |
| Tire Replacement | $400 – $800 | $1,200 – $2,500 | 3x more |
| Engine Oil & Filter | $150 – $300 | $800 – $2,000+ | 5x more |
| Transmission Service | $500 – $1,000 | $3,000 – $8,000 | 5–8x more |
Fleets implementing comprehensive preventive maintenance programs reduce unplanned downtime by 35 to 50 percent annually. For a 20-truck fleet, that difference can mean $80,000 to $150,000 in avoided emergency repair costs and lost revenue per year. Book a demo to see how FleetRabbit automates maintenance scheduling for dry van fleets.
Driver Management and HOS Compliance
Long-haul dry van drivers are among the hardest workers to retain and the most expensive to replace. Recruiting a new CDL driver costs $5,000 to $12,000 on average when you account for advertising, screening, onboarding, and the productivity lost during training. In a market where driver regulations are tightening — including stricter English language proficiency rules and CDL eligibility enforcement — managing your existing driver pool well is more valuable than ever.
Driver Management Priorities in 2026
- Real-time HOS tracking with 30-minute break alerts prevents violations costing $1,000 to $16,000 per incident
- Driver scorecards based on speed, braking, and fuel efficiency tie performance to coaching rather than punishment
- Digital DVIR submissions — now officially accepted by FMCSA — reduce paperwork and accelerate defect routing to maintenance
- Proactive load planning that respects driver home-time preferences reduces turnover in regional operations
- Automatic duty-status recording and audit-ready log exports protect against FMCSA compliance exposure
Lane Strategy and Load Optimization
In 2026's freight market, lane selection is as important as cost control. Deadhead miles — miles driven empty between loads — are one of the fastest profit destroyers in dry van trucking. Every empty mile costs you fuel, driver hours, and equipment wear with zero revenue to show for it. Smart lane strategy minimizes deadhead exposure and maximizes revenue per total mile — not just loaded miles.
Round-Trip Lane Profitability Framework
Always evaluate round-trip profitability, not just outbound rate. Being in the right market at the right time — peak produce season, Q4 retail surge, Midwest manufacturing demand — can add $0.50 to $1.00 per mile over being in a soft market with the same truck.
Compliance, IFTA, and Regulatory Management
Long-haul dry van operations cross state lines constantly — and each state crossing creates IFTA fuel tax obligations, weight permit requirements, and compliance exposure. Manual IFTA tracking costs 8 to 12 hours per truck per quarter. Non-compliant ELDs have been removed from the FMCSA registry. MC numbers are being replaced by USDOT numbers as the primary carrier identifier as of October 2025. Staying current with these changes is not optional — it is the foundation of operating legally and retaining your authority.
2026 Compliance Priorities for Dry Van Fleets
- FMCSA-certified ELD with automatic duty-status recording and audit-ready export
- Automated IFTA mileage allocation and quarterly report generation by state
- Truck-legal routing — consumer GPS systems cause 23 percent of oversize and overweight violations
- Digital DVIR with photo documentation and automatic defect routing to maintenance
- USDOT number compliance in all carrier profiles and documentation since October 2025
2026 Dry Van Market Landscape: What Fleet Managers Need to Know
Operating a dry van fleet without understanding the current market environment is like driving without mirrors. Knowing where rates are heading, where capacity is tightening, and what is putting pressure on margins allows you to make proactive decisions — rather than reactive ones.
Rate Environment in 2026
As of April 2026, national dry van spot rates averaged $2.68 per mile — up 6.3 percent month over month — while van capacity remained 89.6 percent tighter than the same period last year. Contract rates averaged $2.63 per mile nationally. The C.H. Robinson 2026 dry van cost per mile forecast projects an 8 percent year-over-year increase, driven primarily by tightening capacity in the second half of the year as carrier attrition continues. This creates a window of opportunity for fleets that have controlled their operating costs — rate growth in a tightening capacity environment improves margins for well-run operations.
Regional Rate Variations in 2026
Key Pressures on Dry Van Margins in 2026
Fuel Cost Volatility
National diesel average up $1.52/gallon year over year due to global supply disruptions. Every penny change in diesel costs the average 10-truck fleet $1,000+ per month.
Driver Shortage Deepening
Stricter CDL eligibility rules and English language enforcement are shrinking the driver pool, limiting how quickly capacity can respond to demand surges.
Insurance Premium Growth
Premium increases continue driven by nuclear verdicts, rising claims costs, and litigation exposure — with CSA scores directly tied to individual fleet rates.
Equipment Cost Pressure
Truck and trailer costs rose 3.8% in 2024. Tariffs on steel and imported equipment add further pressure. Most fleets are extending trade cycles rather than investing in new assets.
Fleet Performance Benchmarks: How Does Your Operation Measure Up?
Benchmarking your fleet against industry standards is the fastest way to identify where you are losing money and where the highest-ROI improvement opportunities exist. Book a demo with FleetRabbit and we will run a benchmarking analysis against your current operation.
Each percentage point of uptime lost on a 20-truck fleet costs approximately $40,000–$70,000 annually in lost revenue and emergency costs.
Low utilization either means excess trailer count or too much dwell time at customers. Both are fixable with visibility tools.
10% deadhead ratio on 100,000 miles = 10,000 empty miles per truck. At $1.20 cost/mile, that is $12,000 per truck per year in pure waste.
Reactive fleets spend 50–70% of maintenance hours on emergency repairs. Flipping this ratio is the single highest-ROI change most fleets can make.
A 0.5 MPG improvement across a 10-truck fleet running 100,000 miles saves $33,000–$38,000 annually at $4.00/gallon diesel.
Service reliability is increasingly the competitive differentiator as 2026 capacity tightens. Consistent on-time performance justifies premium contract rates.
See Every Metric. Fix Every Leak. Protect Every Margin.
FleetRabbit is the fleet management platform built for dry van operators who are serious about margin discipline in 2026's demanding market. From cost-per-mile dashboards to trailer utilization tracking, predictive maintenance, and driver compliance management — everything you need is in one connected system. Sign up free with no credit card required, or book a 30-minute demo for a walkthrough built around your specific operation.
Frequently Asked Questions About Dry Van Fleet Management
Answers to the most common questions fleet managers ask about running dry van operations efficiently in 2026.
Ready to Run a Tighter, More Profitable Dry Van Fleet?
In 2026's thin-margin freight environment, every cent per mile matters. Every idle trailer costs you. Every unplanned breakdown sets you back weeks. FleetRabbit gives dry van fleet managers the visibility, automation, and intelligence to close every profit leak — from fuel waste and empty miles to emergency repairs and compliance exposure. Fleets using FleetRabbit reduce operating costs by 12 to 18 percent, cut unplanned downtime by 35 to 50 percent, and recover over $200,000 in annual savings. The market is rewarding operators who run lean and smart. Start today.







