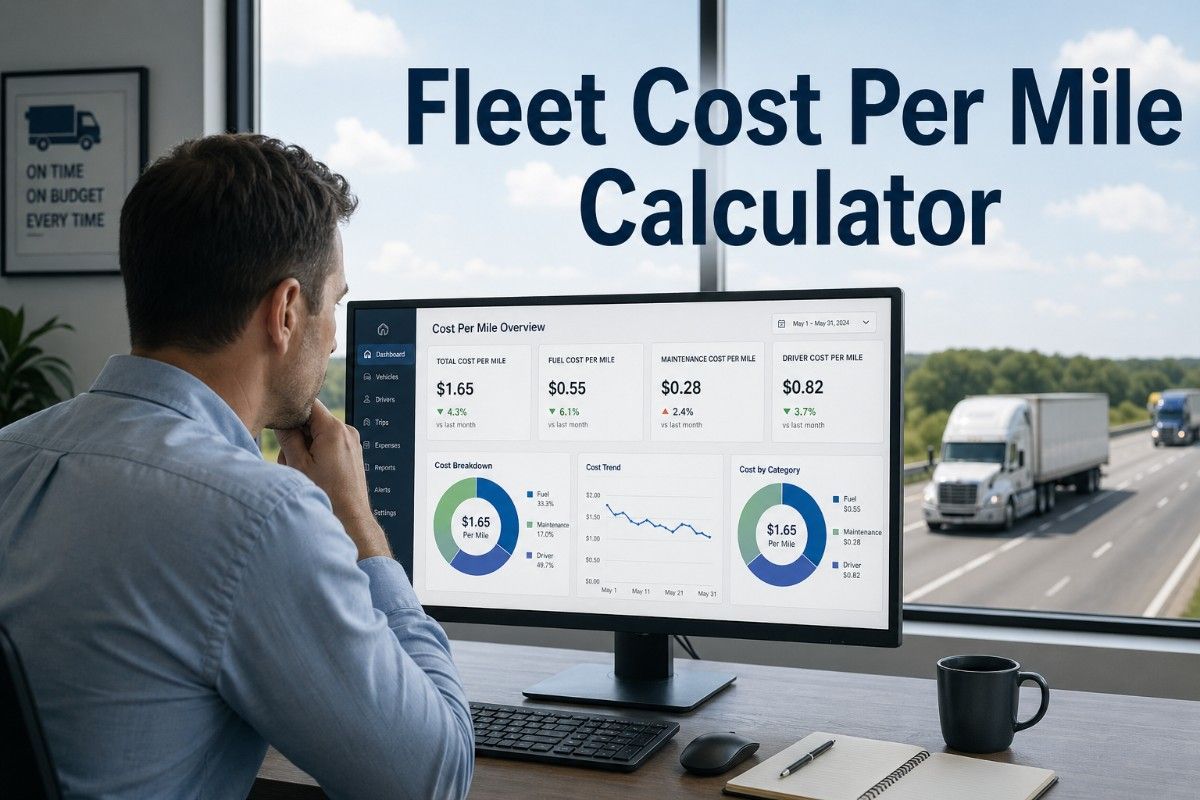
The difference between a profitable trucking fleet and one that barely breaks even often comes down to a single metric: cost per mile. Fleet owners who calculate and track cost per mile with precision know exactly what each mile costs to operate — and which levers to pull when costs rise. Operators who do not calculate cost per mile are flying blind, accepting the rates brokers and shippers offer without knowing whether those rates exceed operating costs. In an industry where margins often run between three and six percent, the difference between accurate cost tracking and guesswork can be the difference between staying in business and closing the doors.
Fleet Finance
Cost Management
High Priority
10 min read
Calculator Overview
This guide provides a complete framework for calculating and analysing fleet cost per mile — including fixed and variable cost identification, calculation formulas, industry benchmark data, cost reduction strategies, and a downloadable calculator template that integrates with your existing expense tracking. Use this framework to determine your true operating cost per mile, establish profitable rate floors for customer negotiations, and identify the specific cost drivers pushing your fleet above industry averages.
$1.85
Average operating cost per mile for dry van truckload carriers — includes fuel, maintenance, driver pay, insurance, and equipment payments
$0.50
to $0.75 per mile — typical profit margin range for well-managed trucking fleets before interest and depreciation
15%
Cost per mile reduction achievable through fuel efficiency improvements, maintenance optimisation, and reduced empty miles
3%
to 6% — typical net profit margin for trucking companies; a small cost increase can erase the entire profit
Why Cost Per Mile Is the Most Important Fleet Metric
Revenue per mile captures what customers pay. Cost per mile captures what operations spend. The gap between them is profit or loss. Fleet operators who cannot calculate their true cost per mile cannot know whether a load at $2.00 per mile is profitable or money-losing. The trucking industry operates on thin margins where a ten cent increase in cost per mile can turn a profitable lane into a money pit. Yet many fleet owners and managers still rely on rough estimates rather than precise calculations — estimating fuel costs, guessing at maintenance expense, and forgetting to allocate insurance and overhead to each mile driven.
Accurate cost per mile calculation serves four critical business functions. First, it establishes the minimum rate you can accept for any load without losing money. Second, it identifies which cost categories are rising fastest, enabling targeted reduction efforts. Third, it provides objective data for customer rate negotiations when contract rates fall below operating costs. Fourth, it creates a baseline for measuring the financial impact of fleet changes — new equipment purchases, maintenance programme adjustments, or driver pay structure modifications. Fleets that calculate cost per mile on every vehicle every month consistently outperform fleets that track revenue per mile without equivalent cost visibility.
Cost Category
Variable Costs — Fuel
Fuel represents the largest variable operating cost for most fleets — typically 25 to 35 percent of total cost per mile. Fuel cost per mile varies with fuel price, fleet average fuel efficiency (miles per gallon), driver behaviour, route characteristics, and idle time. A fleet averaging 6.5 miles per gallon at diesel prices of $3.75 per gallon incurs fuel cost of approximately $0.58 per mile. Improving fuel efficiency to 7.5 miles per gallon reduces fuel cost per mile to $0.50 — saving $0.08 per mile across the fleet.
Cost Category
Variable Costs — Maintenance and Repairs
Maintenance costs vary significantly based on vehicle age, duty cycle, preventive maintenance discipline, and component quality. Typical Class 8 truck maintenance costs range from $0.12 to $0.20 per mile when averaged across the vehicle lifecycle. New vehicles under warranty may cost $0.05 to $0.08 per mile for routine maintenance. Vehicles approaching 500,000 miles can cost $0.25 per mile or more as major components require replacement. Preventive maintenance programmes reduce average maintenance cost per mile compared to reactive maintenance fleets.
Cost Category
Variable Costs — Tyres
Tyre costs include purchase price, mounting and balancing, rotation and alignment services, and tyre disposal. A typical Class 8 tractor and three-axle trailer carries 18 tyres. At replacement cost of $450 per tyre, a full set costs $8,100. With tyre life averaging 100,000 to 150,000 miles on steer axles and 150,000 to 200,000 miles on drive and trailer positions, tyre cost per mile typically ranges from $0.03 to $0.06. Proper inflation and alignment extend tyre life and reduce cost per mile.
Cost Category
Fixed Costs — Driver Pay and Benefits
Driver pay represents the largest fixed cost per mile for most fleets. Company drivers paid $0.55 to $0.70 per mile plus benefits (health insurance, retirement, payroll taxes, workers compensation) bring total driver cost to $0.70 to $0.90 per mile. Owner-operator pay structures differ but driver cost remains a substantial component of total cost per mile. Driver turnover exacerbates cost through recruitment, training, and productivity loss during transition periods.
Cost Category
Fixed Costs — Insurance and Licensing
Insurance costs include liability, cargo, physical damage, and workers compensation coverage. Annual premiums for a well-maintained fleet with good safety records typically range from $8,000 to $15,000 per power unit. Divided by annual miles (100,000 to 120,000 miles per truck), insurance adds $0.07 to $0.15 per mile. Fleets with poor safety records or high claims frequency pay substantially more — sometimes exceeding $0.25 per mile for insurance alone.
Cost Category
Fixed Costs — Equipment and Depreciation
Equipment costs include loan payments or lease expenses, depreciation, and opportunity cost of capital. A new Class 8 tractor costing $160,000 financed over 5 years at 8 percent interest creates monthly payments around $3,250. At 10,000 miles per month, equipment cost equals $0.325 per mile before depreciation. Depreciation adds another $0.20 to $0.30 per mile depending on trade cycles. Used equipment reduces fixed costs but increases variable maintenance costs.
How to Calculate Fleet Cost Per Mile: Step by Step
Cost per mile calculation requires collecting all operating expenses and dividing by total miles driven within the same period. The formula is simple: total operating cost divided by total miles equals cost per mile. The challenge lies in capturing all costs — including expenses that many fleet operators overlook or misclassify. The step-by-step process below ensures complete cost capture.
Step One
Select a Time Period and Vehicle Group
Calculate cost per mile monthly for each vehicle class and quarterly for the total fleet. Monthly calculations catch emerging cost trends before they become annual problems. Per-vehicle-class calculations account for cost differences between tractor types, trailer configurations, and duty cycles. Select a time period long enough to include all expense categories — monthly calculations require capturing periodic expenses such as quarterly insurance payments or annual licence fees through accrual accounting or amortisation.
Step Two
Calculate Total Miles Driven
Sum all miles driven by the vehicle or fleet during the selected period using odometer readings or telematics data. Include both loaded and empty miles — cost per mile on empty miles is pure loss without offsetting revenue. For per-vehicle calculations, ensure odometer readings are accurate and recorded consistently. For fleet calculations, sum odometer readings across all vehicles or use total miles from dispatch records. Do not estimate miles — precise measurement is essential for accurate cost per mile.
Step Three
Capture All Variable Operating Costs
Variable costs increase directly with miles driven. Include fuel purchases (all fuel for the period), maintenance and repair expenses (parts and labour for all service events), tyre purchases and service, tolls and permits, driver pay (cents-per-mile portion), and any other cost that varies with miles. Do not include fixed costs in this step. Variable cost capture often misses small expenses that add up over time: windshield washer fluid, DEF, lubricants, and minor repairs.
Step Four
Capture All Fixed Operating Costs
Fixed costs remain relatively constant regardless of miles driven. Include equipment loan or lease payments, depreciation (calculated as purchase price minus expected resale divided by expected total miles), insurance premiums, licence and registration fees, base driver pay (daily or weekly guarantees, benefits, payroll taxes), and overhead allocation (office expenses, management salaries, technology costs). Calculate fixed cost per mile by dividing total fixed costs by total miles driven during the period.
Step Five
Sum All Costs and Divide by Total Miles
Add total variable costs and total fixed costs to calculate total operating cost for the period. Divide total operating cost by total miles driven to calculate cost per mile. Compare results to industry benchmarks and prior period results. Calculate cost per mile for each vehicle to identify high-cost outliers. Use the per-vehicle variance to target cost reduction efforts on the worst performers before addressing fleet-wide averages.
Cost Per Mile Calculator Template
The calculator template below provides a structured framework for calculating cost per mile for any commercial fleet. Use this template monthly for each vehicle in your fleet to identify cost outliers and track cost trends over time.
Cost Category
Monthly Cost ($)
Annual Cost ($)
DEF and Fuel Additives
_________
_________
Oil and Lubricants
_________
_________
Maintenance and Repairs
_________
_________
Tyres — Purchase and Service
_________
_________
Tolls and Permits
_________
_________
Variable Costs Subtotal
_________
_________
Driver Pay — Cents Per Mile
_________
_________
Driver Benefits and Payroll Tax
_________
_________
Equipment Loan or Lease
_________
_________
Depreciation
_________
_________
Insurance — Liability and Cargo
_________
_________
Insurance — Physical Damage
_________
_________
Licence and Registration
_________
_________
Overhead Allocation
_________
_________
Fixed Costs Subtotal
_________
_________
Total Operating Cost
_________
_________
Total Miles Driven
_________
_________
Cost Per Mile
_________
_________
Cost Per Mile Benchmarks by Fleet Type
Understanding where your fleet's cost per mile falls relative to industry benchmarks provides context for reduction efforts. The table below shows typical cost per mile ranges for various fleet types and operating configurations. Individual fleets vary based on region, equipment age, fuel prices, and operating efficiency.
Dry Van Truckload
$1.65 to $1.95 per mile — This segment includes over-the-road carriers moving non-refrigerated freight. Lower equipment costs than reefers but similar driver and fuel expenses. High utilisation fleets operating newer equipment achieve lower end of range. Owner-operators with paid-off equipment may operate below $1.50 per mile without accounting for replacement reserve.
Refrigerated (Reefer)
$1.80 to $2.15 per mile — Refrigerated fleets incur additional fuel cost for reefer unit operation (0.5 to 0.7 gallons per hour), higher equipment cost, and increased maintenance expense for reefer components. Cost per mile typically runs $0.10 to $0.20 higher than dry van for otherwise comparable operations due to reefer fuel and maintenance.
Flatbed and Specialised
$1.70 to $2.10 per mile — Flatbed fleets incur higher insurance costs due to cargo securement liability, additional equipment costs for tarps and securement hardware, and typically lower fuel efficiency due to aerodynamics. However, specialised freight rates often exceed general freight rates, creating acceptable higher cost structures.
Last-Mile Delivery (Class 5-6)
$1.40 to $1.80 per mile — Medium-duty last-mile vehicles achieve higher fuel efficiency than Class 8 trucks but incur proportionally higher driver cost per mile due to lower average speeds and more stops. Route density significantly affects cost per mile — dense urban routes may show lower cost per stop but higher cost per mile due to congestion.
Regional LTL
$1.55 to $1.85 per mile — Less-than-truckload regional carriers operate both linehaul and pickup-delivery configurations. Cost per mile varies significantly between linehaul (lower cost, higher miles) and P&D (higher cost, lower miles) operations. Fleet average cost per mile depends on the mix of linehaul and P&D activity.
Owner-Operator
$1.20 to $1.60 per mile — Owner-operator cost per mile excludes profit and often excludes replacement reserves. Many owner-operators underprice their services by failing to include depreciation, opportunity cost of capital, and adequate reserves in their cost per mile calculation. True economic cost for owner-operators with newer equipment typically exceeds $1.50 per mile.
Reducing cost per mile requires attacking both variable and fixed cost components. The most effective reduction strategies target categories with the greatest cost impact and the most variable performance across the fleet.
Fuel Cost Reduction
Fuel is the largest variable cost for most fleets. Reduction strategies include driver coaching on fuel-efficient driving techniques (reducing harsh acceleration, maintaining steady speeds, minimising idling), route optimisation to reduce empty and deadhead miles, telematics-based idle monitoring with driver feedback, aerodynamic improvements (side skirts, trailer tails), speed reduction programmes (reducing speed from 70 to 65 mph improves fuel economy by 5 to 7 percent), and network fuel purchasing through preferred vendors with volume discounts.
Maintenance Cost Reduction
Preventive maintenance reduces cost per mile by catching small issues before they become expensive failures. Strategies include strict adherence to PM intervals (oil changes, filter replacement, brake inspections), predictive maintenance using telematics data (engine parameters, brake wear sensors, tyre pressure monitoring), extended lifecycle component strategies (retread tyres, remanufactured parts), in-house maintenance for routine service with outsourcing for major repairs, and technician training to reduce diagnostic time and improve first-time fix rates.
Empty Mile Reduction
Empty miles generate fuel, maintenance, driver pay, and insurance expense without offsetting revenue. Strategies to reduce empty miles include load board optimisation to find backhauls, dedicated lane analysis to identify routes with consistent directional imbalances, broker relationships for backhaul freight, collaborative shipping arrangements with other carriers, and network redesign to position drivers in freight-rich areas. Reducing empty miles from 15 percent of total miles to 10 percent reduces total cost per mile by reducing the denominator — every loaded mile carries less allocated fixed cost.
Equipment Cycle Optimisation
Equipment age significantly affects cost per mile. Newer equipment has higher fixed costs (depreciation, payments) but lower variable costs (fuel efficiency, maintenance). Older equipment has lower fixed costs but higher variable costs. The optimal trade cycle balances these factors — typically 4 to 6 years or 400,000 to 600,000 miles for Class 8 trucks. Extending cycles beyond the optimal point increases maintenance costs faster than fixed costs decline. Shortening cycles increases fixed costs faster than variable costs decline.
Driver Retention and Productivity
Driver turnover costs typically range from $10,000 to $15,000 per replacement when including recruitment, training, and productivity loss. Reducing turnover through competitive pay, predictable home time, and positive work environment reduces cost per mile by spreading recruitment and training costs over more miles. Increasing driver productivity through efficient dispatch, reduced detention time, and optimised route planning spreads fixed costs over more miles — reducing cost per mile without reducing total cost.
Insurance Cost Management
Insurance premiums respond directly to safety performance. Strategies to reduce insurance cost per mile include collision avoidance technology installation (cameras, collision warning, automatic braking), driver safety training programmes, telematics-based safety scoring with coaching for high-risk drivers, crash review processes that identify root causes, and safety incentive programmes that reward clean inspection and accident-free operation. Fleets that reduce crash frequency and severity see insurance cost reductions of 10 to 20 percent over three to five year periods.
Even experienced fleet managers make predictable errors when calculating cost per mile. These mistakes create false confidence in profitability or unnecessary concern about costs. Avoiding the errors below ensures accurate cost visibility.
Mistake 1: Excluding Overhead Costs
Many fleets calculate cost per mile based only on direct operating costs — fuel, maintenance, driver pay, equipment payments — while excluding overhead expenses such as management salaries, office rent, technology subscriptions, legal and accounting fees, and marketing costs. Excluding overhead understates true cost per mile by $0.10 to $0.25 depending on fleet size and overhead structure. Include a reasonable overhead allocation in cost per mile calculations to ensure rates cover all business costs.
Mistake 2: Using Average Cost Rather Than Full Lifecycle Cost
Calculating cost per mile based on a single month or quarter fails to capture periodic expenses such as major component replacements, tyre purchases, and annual insurance premiums. A vehicle may show low cost per mile for eleven months then spike in the twelfth month when new tyres and brakes are installed. Solution: calculate rolling 12-month cost per mile or amortise periodic expenses across expected miles between service events.
Mistake 3: Failing to Separate Vehicle Classes
Calculating cost per mile for the entire fleet masks significant variation between vehicle classes. A fleet operating both long-haul tractors (low cost per mile due to high annual miles) and day cab urban trucks (high cost per mile due to low annual miles) may show acceptable average cost per mile while both vehicle classes are actually unprofitable for different reasons. Calculate cost per mile separately for each vehicle class and duty cycle.
Mistake 4: Ignoring Depreciation or Replacement Reserve
Owner-operators and small fleets often exclude depreciation from cost per mile calculations because it does not represent cash outlay. However, every vehicle eventually requires replacement. Fleets that fail to accumulate replacement reserves cannot purchase new equipment when existing vehicles wear out. Include depreciation or a replacement reserve of $0.15 to $0.25 per mile to ensure long-term fleet sustainability.
Mistake 5: Mismatching Time Periods for Costs and Miles
Cost per mile calculations require aligning costs and miles from the same time period. Using fuel purchases from January with miles driven in February creates inaccurate results due to timing mismatches. Use accrual accounting for fuel and maintenance — record expenses when incurred rather than when paid — or use a rolling average that smooths timing differences. Telematics data enables exact matching of fuel purchases to miles driven.
Mistake 6: Failing to Track Empty Miles Separately
Empty miles generate cost without revenue. Fleets that track only loaded miles show lower cost per loaded mile but miss the profit impact of empty repositioning. Calculate both loaded cost per mile and total cost per mile. The gap between these metrics represents the cost of empty miles. Reducing empty miles improves total fleet profitability without affecting loaded cost per mile.
What is a good cost per mile for a trucking company?
A competitive cost per mile varies by fleet type, region, and equipment age. For dry van truckload carriers, $1.70 to $1.85 per mile represents good performance. For refrigerated carriers, $1.85 to $2.00 per mile is competitive. For last-mile delivery, $1.40 to $1.60 per mile is typical. The most meaningful comparison is your own cost per mile trend over time — improving cost per mile through efficiency gains is more valuable than hitting a specific benchmark, as benchmarks vary significantly with fuel prices, insurance costs, and regional wage rates.
How do I calculate cost per mile for an owner-operator?
Owner-operator cost per mile includes all the same categories as fleet cost per mile plus additional owner-specific expenses. Calculate total annual operating costs — fuel, maintenance, tyres, insurance, truck payment or lease, permits, tolls, driver pay (your own compensation), health insurance, retirement contributions, and business overhead. Divide by total annual miles. Many owner-operators exclude their own compensation or depreciation, creating artificially low cost per mile. True economic cost including owner compensation and replacement reserves typically ranges from $1.20 to $1.60 per mile depending on equipment age and operating efficiency.
How does fuel price affect cost per mile?
Each $0.10 increase in diesel price adds approximately $0.015 to $0.017 to cost per mile for a fleet averaging 6.5 miles per gallon. A fleet averaging 7.5 miles per gallon adds $0.013 to $0.014 per mile for the same fuel price increase. Fuel surcharge programmes typically recover fuel cost increases from customers — but only if your cost per mile calculation accurately captures the fuel cost component.
Book a demo to see how FleetRabbit tracks fuel cost per mile in real time.
How often should fleets calculate cost per mile?
Fleets should calculate cost per mile monthly for each vehicle and quarterly for the total fleet. Monthly calculations catch emerging cost trends before they become annual problems. Per-vehicle calculations identify outliers requiring attention. Quarterly fleet calculations provide trend data for strategic decisions — rate negotiations, equipment purchases, and lane profitability analysis. Fleets that calculate cost per mile only annually miss seasonal variations and cannot respond quickly to cost increases.
Book a demo to see automated cost per mile tracking with FleetRabbit.
What is the difference between cost per mile and total cost of ownership?
Cost per mile measures operating cost per unit of distance — typically calculated monthly or annually for active fleet vehicles. Total cost of ownership (TCO) measures the complete cost of owning a vehicle from acquisition to disposal, including purchase price, financing costs, depreciation, operating costs, maintenance, and resale value. TCO supports equipment purchasing decisions, comparing different makes and models over their expected lifecycle. Cost per mile supports pricing and operational efficiency decisions. The two metrics complement each other — fleets with low TCO typically achieve low cost per mile, but cost per mile optimisation may sometimes conflict with TCO minimisation.
April 25, 2026
By Jason Smith
All Posts