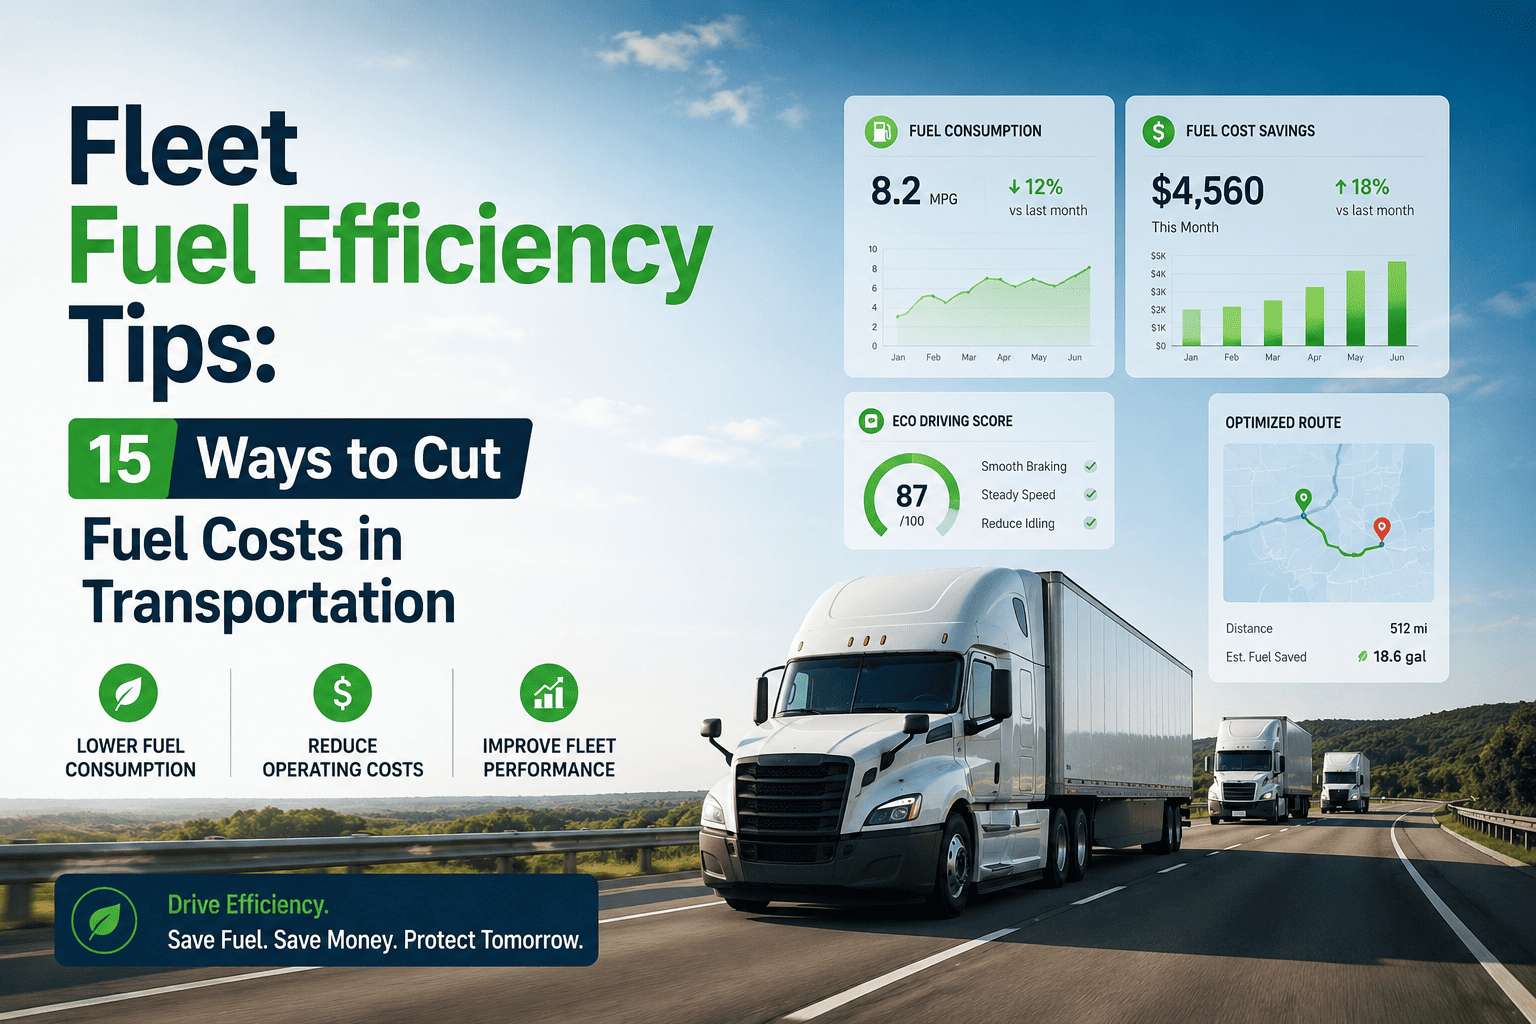
Fuel is the single largest operating expense for most transportation fleets, typically accounting for 25-35% of total operating costs. For a fleet of 50 trucks running 120,000 miles annually per vehicle, a one cent per mile fuel savings generates $60,000 in annual profit improvement. While 78% of fleet managers identify fuel costs as their top financial concern, only 34% have implemented systematic fuel efficiency programs that deliver measurable savings. Carriers who master fuel efficiency achieve 15-25% lower fuel costs than industry averages, reducing expenses by $0.10-$0.20 per mile while maintaining or improving service levels. The difference between fuel-efficient operations and high-cost fleets isn't luck or favorable routes—it's systematic application of proven fuel-saving strategies across vehicles, drivers, and operations. This comprehensive guide reveals 15 specific, actionable fleet fuel efficiency tips that reduce consumption, lower costs, and improve profitability starting with your next fill-up.
2025 Fuel Cost Impact Alert
Critical Financial Data: At current diesel prices averaging $4.00 per gallon, a truck achieving 6.5 MPG costs $0.615 per mile in fuel. Improving to 7.5 MPG reduces cost to $0.533 per mile—saving $0.082 per mile. For a truck running 120,000 annual miles, that's $9,840 per vehicle per year. For a 50-truck fleet, that's $492,000 annual savings—straight to the bottom line. Fuel efficiency isn't environmental idealism; it's financial necessity. The 15 strategies in this guide deliver 0.5-2.5 MPG improvements depending on current performance, creating massive profit potential for fleets that implement systematically.
Why Fuel Efficiency Matters Beyond Cost Savings
Fuel efficiency delivers benefits beyond direct expense reduction. Lower fuel consumption reduces emissions, improves sustainability metrics for customer RFPs, extends vehicle range, reduces refueling downtime, and decreases maintenance costs associated with engine wear. Understanding the full benefit spectrum motivates sustained focus on efficiency improvement rather than one-time cost-cutting measures that sacrifice other operational priorities.
The Financial Impact of Fuel Efficiency Improvements
Small MPG improvements generate substantial annual savings. A fleet averaging 6.0 MPG that improves to 6.5 MPG reduces fuel consumption by 7.7%—a $0.05 per mile saving at $4.00/gallon diesel. For a 100-truck fleet running 100,000 miles annually per truck, that's $500,000 per year. Larger improvements generate proportionally larger savings. Calculate your fleet's fuel saving potential in under 10 minutes, or schedule a fuel efficiency consultation.
Annual Fuel Savings by MPG Improvement (120,000 miles/year at $4.00/gallon)
Start Saving Fuel Today
Our fuel efficiency management system tracks consumption, identifies waste, and recommends specific savings opportunities for your fleet—turning fuel data into actionable cost reduction.
Strategy 1: Implement Comprehensive Driver Eco-Driving Training
Driver behavior is the single largest controllable factor in fuel efficiency, accounting for up to 30% of variation in fuel consumption between drivers operating identical vehicles on similar routes. Systematic eco-driving training produces immediate, measurable fuel savings that persist with ongoing reinforcement.
Critical Eco-Driving Behaviors That Save Fuel
Specific driving behaviors have disproportionate impact on fuel consumption. Training drivers on these behaviors and monitoring compliance through telematics produces rapid MPG improvements. Access our eco-driving training program free for 30 days, or schedule driver training consultation.
High-Impact Eco-Driving Behaviors:
- Smooth Acceleration: Aggressive acceleration increases fuel consumption by 20-40% compared to moderate acceleration. Target 0-10 mph in 15-20 seconds for heavy trucks. Train drivers to imagine an egg under the accelerator pedal.
- Reduced Speeding: Every 5 mph over 55 mph increases fuel consumption by 7-10%. At 75 mph, a truck uses 27% more fuel than at 55 mph. Cruise control at optimal speeds maximizes efficiency.
- Anticipatory Driving: Looking 12-15 seconds ahead to avoid unnecessary braking and acceleration. Coasting to stops rather than braking late. Maintaining momentum through traffic flow.
- Progressive Shifting: Shifting up at lower RPMs (1,200-1,400 RPM for most diesels) rather than revving to 1,800+ RPM before shifting. Skip shifting when appropriate under light loads.
- Reduced Idling: Idling consumes 0.5-1.0 gallons per hour for heavy trucks. Eliminating 1 hour of unnecessary idling per day saves 250-350 gallons annually per truck.
- Speed Management on Grades: Allowing speed to decrease slightly on uphill grades (within 5 mph of target) rather than applying full throttle. Using momentum to reduce fuel consumption on climbs.
- Minimized Brake Applications: Using engine braking and downshifting rather than service brakes when possible. Each brake application wastes energy previously used to accelerate.
- Optimal Following Distance: Maintaining 4-6 second following distance reduces unnecessary braking and acceleration cycles from traffic flow variations.
Eco-Driving Training ROI:
- Initial Training Impact: 8-15% fuel consumption reduction immediately following comprehensive eco-driving training
- Ongoing Coaching Impact: Additional 5-10% reduction with monthly coaching based on telematics data
- Incentive Program Impact: 3-7% reduction with performance-based driver incentives
- Training Cost: $500-2,000 per driver depending on method (classroom, simulator, on-road)
- Payback Period: 1-4 months based on fuel savings and training investment
Strategy 2: Optimize Routes to Minimize Miles and Maximize Efficiency
Route optimization eliminates unnecessary miles, reduces empty backhauls, and improves load factors—all directly reducing fuel consumption. While many fleets believe they're already running optimal routes, advanced routing software typically identifies 5-15% mileage reduction opportunities.
Route Optimization Techniques That Save Fuel
Beyond basic shortest-path routing, sophisticated optimization considers traffic patterns, delivery windows, vehicle capabilities, and driver hours to minimize fuel consumption while meeting service requirements. Access our route optimization assessment free for 30 days, or schedule a routing consultation.
Route Optimization Savings Opportunities
Optimize Your Routes Automatically
Our route optimization engine analyzes traffic patterns, delivery windows, vehicle specifications, and driver hours to create fuel-efficient routes that reduce miles and improve profitability.
Strategy 3: Reduce and Manage Vehicle Idling
Idling is the most wasteful fuel consumption pattern, producing zero productive miles while burning fuel, accumulating engine hours, and increasing maintenance costs. For heavy-duty trucks, idling consumes 0.5-1.0 gallons per hour. A truck idling 6 hours per day (common for overnight parking) uses 1,500-2,200 gallons annually—$6,000-8,800 at current diesel prices.
Idle Reduction Strategies and Technologies
Reducing idling requires a combination of policy, technology, driver education, and alternative equipment. The most effective programs use multiple approaches tailored to specific operational patterns. Access our idle reduction toolkit free for 30 days, or schedule an idle reduction consultation.
Idle Reduction Methods by Situation:
- Policy and Monitoring: Establish maximum idle time policies (typically 3-5 minutes for warm-up/cool-down, 10 minutes for extended idling without APU). Monitor compliance through telematics. Implement progressive discipline for excessive idling.
- Auxiliary Power Units (APUs): Diesel APUs consume 0.1-0.2 gallons per hour—80-90% less than main engine idling. Cost $8,000-12,000 installed; payback 12-24 months for fleets with significant overnight idling.
- Battery Electric APUs: Electric systems with batteries and HVAC use zero fuel but require overnight charging. Cost $10,000-15,000; payback 18-30 months with electricity costing significantly less than diesel.
- Truck Stop Electrification: Shore power connections at truck stops eliminate idling. Requires compatible vehicle equipment ($1,000-3,000). Payback varies by usage frequency.
- Automatic Engine Start/Stop: Systems that automatically shut down engine after preset idle time and restart when cab temperature or battery voltage requires. $500-1,500; immediate payback for excessive idling fleets.
- Driver Education: Many drivers underestimate idle fuel consumption. Provide real-time idle time feedback through in-cab displays. Share idle cost reports showing individual consumption.
- Thermal Storage Systems: Phase-change materials that store cooling capacity during driving for use during stops. Zero idle fuel consumption. $3,000-6,000; payback 12-24 months.
Strategy 4: Maintain Proper Tire Inflation Pressure
Underinflated tires are a silent fuel efficiency killer. Every 10% underinflation increases rolling resistance by 5% and reduces fuel economy by 1-2%. For a fleet with chronic underinflation of 20% (common in poorly managed fleets), fuel economy penalty reaches 2-4%—$0.02-0.04 per mile or $2,400-4,800 per truck annually.
Tire Pressure Management Best Practices
Maintaining optimal tire pressure requires systematic processes rather than occasional checks. The best fleets check pressures weekly and use technology to maintain pressure continuously. Access our tire management system free for 30 days, or schedule a tire efficiency consultation.
Tire Pressure Management Essentials:
- Weekly Pressure Checks: Tire pressure naturally loses 1-2 PSI per month. Weekly checks maintain optimal pressure. Check when tires are cold (before driving or after 3+ hours stationary).
- Auto Tire Inflation Systems (ATIS): Automatic systems maintain pressure continuously using vehicle air supply. Cost $1,500-3,000 per tractor/trailer. Payback 12-24 months through fuel savings plus tire life extension.
- Tire Pressure Monitoring Systems (TPMS): Wireless sensors transmit real-time pressure to in-cab display and fleet management system. Cost $500-1,500 per vehicle. Payback 6-12 months through fuel savings plus reduced roadside events.
- Correct Pressure Specifications: Use manufacturer-recommended pressures for actual load, not maximum sidewall pressure. Under-load conditions allow lower pressures that improve fuel economy and ride quality.
- Valve Maintenance: Replace valve cores annually to prevent slow leaks. Use metal valve caps with seals to prevent contamination and minor leakage.
- Driver Pressure Checks: Incorporate pressure checks into pre-trip inspection. Many fleets achieve higher compliance with automatic systems than manual checks.
Strategy 5: Reduce Vehicle Speed
Speed is the largest single determinant of fuel consumption at highway speeds. Aerodynamic drag increases exponentially with speed—doubling speed quadruples drag. The fuel economy penalty for speeds above optimal are substantial and immediate.
Fuel Economy Impact by Speed (Typical Class 8 Truck)
Speed Management Strategies:
- Governor Settings: Set vehicle speed governors at optimal speed for your operation (62-68 mph typical for long-haul). Reducing governor from 75 mph to 65 mph improves fuel economy 10-15% with minimal trip time impact (30 minutes per 300 miles).
- Cruise Control Usage: Encourage or mandate cruise control use on highways where conditions permit. Cruise control maintains consistent speed, eliminating inefficient speed variations.
- Time vs. Fuel Tradeoff Analysis: Calculate actual cost of speed. A 300-mile trip at 65 mph takes 4 hours 37 minutes; at 75 mph takes 4 hours 0 minutes—37 minutes saved but fuel cost increases $15-20. Unless driver wages exceed $30/hour, slower speed saves money.
- Incentive Alignment: If drivers are paid by mile with fuel paid by fleet, they have financial incentive to speed (more miles per hour). Adjust compensation or provide fuel efficiency bonuses to align incentives.
- Customer Expectations: Most customers care about delivery windows, not speed. As long as you meet windows, slower speeds are acceptable. Build buffer time into schedules to enable efficient speeds.
Monitor and Manage Fleet Speed
Our telematics platform tracks speed events, identifies excessive speeding patterns, and provides coaching tools to reduce average speed and improve fuel economy across your fleet.
Strategy 6: Optimize Vehicle Aerodynamics
Aerodynamic drag accounts for 50-60% of fuel consumption at highway speeds. Modern aerodynamic improvements can reduce drag by 20-30%, producing 5-10% fuel economy improvements for highway-heavy operations.
Aerodynamic Upgrade Options and ROI
Various aerodynamic devices reduce drag at different costs and effectiveness levels. The optimal package depends on operating speeds, routes, and trailer types. Access our aero upgrade calculator free for 30 days, or schedule an aerodynamics consultation.
Aerodynamic Device ROI Analysis
Strategy 7: Implement Predictive Cruise Control and Grade Technology
Advanced cruise control systems use GPS and terrain data to optimize speed on hills, reducing fuel consumption by 3-6% on rolling terrain without increasing trip time. These systems anticipate upcoming grades and adjust speed before the grade begins, avoiding inefficient full-throttle climbs.
Predictive Cruise Control Benefits
Predictive cruise control is one of the highest-ROI technology investments for fleets operating on varied terrain. Understanding the technology and implementation requirements enables informed investment decisions. Access our predictive cruise ROI calculator free for 30 days, or schedule a technology consultation.
Predictive Cruise Control Specifications:
- How It Works: Uses GPS and 3D terrain maps to see the road ahead. Before an uphill grade, allows speed to increase slightly (using momentum). On the grade, maintains optimal speed rather than constantly adjusting. Before downhill grades, reduces speed to minimize braking.
- Fuel Savings: 3-6% on rolling terrain; 1-3% on flat terrain; 5-8% on mountainous routes. Savings increase with terrain variation.
- Implementation Requirements: Compatible engine/transmission (most newer Class 8 trucks), GPS receiver (often factory-installed), terrain map database (subscription typically $100-200 annually per truck).
- Driver Acceptance: Most drivers prefer predictive cruise to standard cruise due to smoother operation and less shifting/braking.
- Manufacturer Availability: Detroit Assurance (Freightliner), Volvo I-See, Mack Predict, Cummins Predictive Cruise, Eaton SmartShift.
- Aftermarket Options: Limited—most systems require OEM integration. Best to specify on new truck orders or retrofits from OEM dealers.
Strategy 8: Reduce Parasitic Loads and Auxiliary Consumption
Every component that draws power from the engine increases fuel consumption. Fans, alternators, air compressors, and hydraulic pumps all create parasitic loads that reduce fuel economy. Optimizing these systems saves fuel without affecting primary vehicle functions.
Parasitic Load Reduction Opportunities:
- Clutching Fans: Ensure engine cooling fans engage only when needed, not continuously. Fan operation consumes 10-30 horsepower—reducing fuel economy by 2-5% when engaged. Test fan clutch operation regularly.
- Alternator Management: Alternators create constant parasitic load. Smart alternators reduce output when batteries are fully charged. Specify fuel-efficient alternators on new equipment.
- Air Compressor Cycling: Ensure air compressor governor cycles properly, not running continuously. Test compressor cycle frequency. Repair leaks that cause excessive cycling.
- Power Steering Efficiency: Use synthetic power steering fluid to reduce parasitic loss. Ensure belt tension is correct (not over-tightened).
- HVAC Operation: Air conditioning consumes 5-10 horsepower. Use recirculation mode when possible. Park in shade to reduce initial cooling load. Consider auxiliary HVAC for sleeper berths.
- Inverter Efficiency: High-efficiency inverters (90%+ efficiency) waste less power as heat. Size inverters appropriately for actual loads rather than peak possible loads.
Strategy 9: Optimize Vehicle Weights and Reduce Curb Weight
Every extra pound carried requires additional fuel. While payload is necessary revenue-producing weight, excessive curb weight from heavy components, unnecessary equipment, and carried debris wastes fuel on every trip.
Weight Reduction Fuel Savings
Spec Fuel-Efficient Equipment
Our equipment specification tool analyzes lifecycle costs of component options, identifying optimal specifications that balance fuel efficiency, durability, and total cost of ownership.
Strategy 10: Implement Fuel-Efficient Routing to Avoid Congestion
Stop-and-go traffic destroys fuel economy. A truck achieving 7.0 MPG at steady highway speeds may achieve only 3-4 MPG in heavy congestion. Avoiding congestion through route selection, time-of-day scheduling, and real-time traffic avoidance produces substantial fuel savings.
Congestion Avoidance Strategies
Fuel-efficient routing prioritizes traffic flow over absolute shortest distance. Adding 10 miles of highway to avoid 30 minutes of city congestion usually saves fuel despite the extra distance. Access our traffic optimization system free for 30 days, or schedule a routing consultation.
Congestion Avoidance Techniques:
- Time-of-Day Routing: Shift delivery windows to avoid peak congestion periods. Early morning (4-7 AM) and late evening (7-10 PM) often provide 20-40% faster travel times with significantly better fuel economy.
- Real-Time Traffic Integration: GPS systems with live traffic data reroute around incidents automatically. Even 10-15 minute delays avoided pay for the technology multiple times annually.
- Historical Traffic Pattern Analysis: Use traffic pattern data for route planning. Some routes are always congested at certain times regardless of incidents—avoid them during those periods.
- Left Turn Reduction: Left turns across traffic increase idle time and accelerate/brake cycles. Route planning that favors right turns improves fuel economy 3-5% for urban delivery operations.
- Construction Zone Awareness: Monitor construction schedules and reroute around major projects. Construction zones combine speed reductions with congestion and rough pavement—all harming fuel economy.
Strategy 11: Upgrade to Low-Viscosity Lubricants
Low-viscosity engine oils, transmission fluids, and driveline lubricants reduce internal friction, improving fuel economy by 1-2% with no other changes. Modern synthetic lubricants provide better protection at lower viscosities than conventional oils.
Lubricant Specifications for Fuel Efficiency
Proper lubricant selection balances fuel economy gains with equipment protection requirements. Understanding viscosity grades and specifications ensures optimal results. Access our lubricant selection guide free for 30 days, or schedule a lubricant consultation.
Fuel-Efficient Lubricant Specifications:
- Engine Oil: Upgrade from 15W-40 to 10W-30 or 5W-30 synthetic where OEM permits. Fuel savings 1-2%. Confirm warranty compatibility before changing.
- Transmission Fluid: Synthetic transmission fluids reduce drag and improve cold-weather shifting. Fuel savings 0.5-1%. Extends drain intervals, reducing maintenance costs.
- Differential Lubricants: Synthetic gear oils reduce driveline friction. Fuel savings 0.5-1%. Improved cold-flow properties reduce warm-up time.
- Wheel Bearing Grease: Low-friction greases reduce rolling resistance. Minimal direct fuel impact but extends bearing life.
- Implementation Cost: Synthetic lubricants cost 2-3x conventional but extend drain intervals 2-4x, often reducing overall lubricant cost while saving fuel.
Strategy 12: Implement Driver Incentive Programs for Fuel Efficiency
Financial incentives align driver behavior with fleet fuel economy goals. Well-designed incentive programs reduce fuel consumption 5-15% beyond training alone by providing ongoing motivation for efficient driving.
Effective Fuel Incentive Program Design
Incentive programs require careful design to achieve desired results without creating unintended consequences. The most effective programs reward improvement, not just absolute performance. Access our incentive program template free for 30 days, or schedule incentive design consultation.
Fuel Incentive Program Structures
Implement Driver Fuel Incentives
Our driver incentive management system tracks MPG, calculates bonuses automatically, and provides real-time performance feedback—eliminating manual calculations and disputes.
Strategy 13: Optimize Transmission and Drivetrain Specifications
Transmission and drivetrain specifications dramatically affect fuel economy. Direct-drive transmissions, optimized axle ratios, and automated manual transmissions (AMTs) all contribute to efficiency improvements.
Drivetrain Specifications for Fuel Economy:
- Automated Manual Transmissions (AMTs): AMTs consistently shift more efficiently than most drivers, improving fuel economy 2-5% compared to manual transmissions. Most new Class 8 trucks now spec AMTs for fuel economy and driver recruitment benefits.
- Direct-Drive vs. Overdrive: Direct-drive transmissions (1:1 top gear) are more efficient than overdrive transmissions because they eliminate gear reduction losses. Specify direct-drive for most applications.
- Axle Ratio Optimization: Lower numerical axle ratios (2.64, 2.85) reduce engine RPM at highway speeds, improving fuel economy. Ensure ratio allows adequate startability and gradeability for your routes.
- Downspeeding: Operating engines at lower RPMs (1,100-1,300 RPM at cruise) significantly improves fuel economy. Requires compatible drivetrain and enough torque at lower RPMs.
- Torque Management: Electronic torque limiting reduces peak torque when not needed. Smoothes acceleration and reduces driveline stress while saving fuel.
Strategy 14: Implement Comprehensive Fuel Data Management and Analytics
You cannot improve what you do not measure. Comprehensive fuel data management—tracking consumption by vehicle, driver, route, and time period—identifies waste sources and quantifies improvement opportunities.
Fuel Analytics That Drive Action
Raw fuel data has limited value without analysis and action. Effective fuel management transforms consumption data into actionable insights. Access our fuel analytics platform free for 30 days, or schedule a fuel analytics consultation.
Essential Fuel Analytics and Their Value
Strategy 15: Maintain Optimal Engine and Component Performance
Properly maintained engines and components operate at peak efficiency. Deteriorating performance from poor maintenance, worn components, or incorrect adjustments reduces fuel economy incrementally but substantially over time.
Maintenance Items Affecting Fuel Economy:
- Air Filter Condition: Restricted air filters reduce combustion efficiency. Replace at manufacturer intervals or when restriction gauge indicates. Clogged filters reduce MPG 2-5%.
- Fuel Filter Condition: Restricted fuel filters reduce injector performance. Replace at specified intervals. Use OEM-quality filters for optimal performance.
- Injector Condition: Worn or dirty injectors reduce fuel atomization, wasting fuel. Test injectors annually. Rebuild or replace underperforming injectors.
- Turbocharger Health: Boost leaks or worn turbochargers reduce combustion air. Check boost pressure annually. Repair leaks immediately.
- EGR System Function: Sticking EGR valves or clogged coolers reduce efficiency. Clean EGR system at specified intervals. Address check engine lights immediately.
- Wheel Alignment: Misaligned wheels increase rolling resistance and tire wear. Check alignment annually or when tire wear patterns indicate. Correct alignment improves MPG 1-3%.
- Brake Drag: Dragging brakes constantly consume fuel. Check for hot wheels after driving. Repair sticking calipers or air chambers promptly.
- Engine Timing: Incorrect valve or injection timing reduces efficiency. Verify timing during major service intervals.
Track and Improve Fleet Fuel Efficiency
Our comprehensive fuel management platform combines all 15 strategies into a single system—tracking consumption, identifying waste, recommending improvements, and measuring results automatically.
Conclusion: Implementing Your Fleet Fuel Efficiency Program
Fuel efficiency improvement is not a single project but an ongoing program requiring sustained attention. The 15 strategies in this guide range from low-cost behavioral changes to significant capital investments. The most effective approach implements multiple strategies simultaneously, creating cumulative savings that far exceed any single intervention.
Start with no-cost strategies: driver training, speed management, idle reduction policies, and route optimization. These typically deliver 10-15% savings with zero capital investment. Then implement low-cost strategies: tire pressure management, fuel analytics, and driver incentives. These deliver additional 5-10% savings with minimal investment. Finally, invest in capital improvements: aerodynamic devices, low-viscosity lubricants, predictive cruise control, and equipment specification optimization. These deliver another 10-15% savings with payback periods typically under 12 months.
The cumulative impact of implementing all applicable strategies typically reaches 25-35% fuel consumption reduction—transforming fuel from your largest expense to a manageable, optimized cost. More importantly, these savings continue year after year, compounding into millions of dollars of improved profitability over time.
Remember, fuel efficiency is a competitive weapon. In markets where every bid is tight, fleets with 25% lower fuel costs win profitable business while competitors struggle. Start your fuel efficiency program today—measure current consumption, identify the highest-opportunity strategies for your operation, implement systematically, and track results religiously. The fuel savings are waiting. Start your fuel efficiency program in under 15 minutes, or schedule a comprehensive fuel efficiency consultation.
Cut Your Fuel Costs by 15-25% Starting Today
Join thousands of fleets that reduced fuel consumption and improved profitability with FleetRabbit's integrated fuel efficiency management system. All 15 strategies, one platform, measurable results.
Frequently Asked Questions About Fleet Fuel Efficiency
Q: How quickly can I see fuel savings after implementing efficiency strategies?
Fuel savings appear immediately for behavioral strategies and gradually for mechanical improvements. Driver training produces savings starting with the first trip after training—drivers apply learned techniques immediately. Speed management, idle reduction, and route optimization also produce immediate results. Mechanical improvements (aerodynamics, tires, lubricants) show full effect within 1-2 weeks as systems reach operating conditions. Maintenance improvements (air filters, injectors, alignment) show effect immediately upon repair completion. The fastest ROI typically comes from addressing driver behavior (1-4 month payback), followed by tire pressure management (1-3 months), speed reduction (immediate), and idle reduction (immediate to 12 months depending on APU investment). Most fleets see measurable fuel savings within the first week of implementing a comprehensive program.
Q: What is the single most effective fuel efficiency strategy for most fleets?
For most fleets, driver behavior modification through eco-driving training and incentive programs delivers the largest single improvement, typically 10-20% fuel consumption reduction. Driver behavior affects every mile driven and compounds with other strategies. However, the "most effective" strategy varies by fleet. For fleets with excessive idling, idle reduction provides largest savings. For high-speed fleets, speed reduction dominates. For fleets with poor maintenance, basic mechanical repairs produce biggest gains. For fleets with inefficient routes, route optimization leads. The most effective approach is to measure your fleet's specific patterns using fuel analytics, then prioritize strategies addressing your largest waste sources. A fleet averaging 6.0 MPG with high idling should target idling first; a fleet averaging 6.0 MPG with low idling but high speeds should target speed first.
Q: Do fuel-saving additives and devices work?
Most aftermarket fuel-saving additives and devices do not deliver claimed savings and many are outright fraudulent. The EPA maintains a list of tested and verified fuel-saving technologies through its SmartWay program. Verified technologies include: low-rolling-resistance tires (2-4% savings), aerodynamic devices (3-15% depending on application), automatic tire inflation systems (1-2% plus tire life extension), and idle reduction technologies (70-90% idle fuel reduction). Unverified additives, magnetic fuel conditioners, hydrogen generators, and vortex generators have repeatedly failed independent testing. The Federal Trade Commission has prosecuted numerous fuel-saving device manufacturers for false claims. Before purchasing any fuel-saving product, demand third-party testing results from recognized organizations (EPA, SAE, TMC). If a product claims 10%+ savings with simple installation, it's almost certainly fraudulent.
Q: How does fuel efficiency affect maintenance costs and vehicle life?
Fuel-efficient operation typically reduces maintenance costs and extends vehicle life. Eco-driving behaviors (smooth acceleration, reduced speeding, reduced idling) reduce wear on brakes, tires, engine, and transmission. Reduced idling decreases engine hour accumulation, extending overhaul intervals. Lower speeds reduce component stress and heat buildup. Proper tire pressure extends tire life 10-20% while saving fuel. Low-viscosity lubricants provide better cold-start protection and reduce wear. The maintenance savings from fuel-efficient operation often approach the fuel savings themselves. Conversely, fuel-wasting behaviors (aggressive driving, excessive idling, speeding) accelerate component wear, increase maintenance costs, and shorten vehicle life. The most fuel-efficient fleet is typically also the lowest-maintenance fleet.
Q: What MPG should my fleet achieve, and how do I compare to industry averages?
MPG expectations vary dramatically by operation type. Industry average MPG benchmarks: Long-haul van (6.5-7.5 MPG), Long-haul flatbed (6.0-7.0 MPG), Regional LTL (6.0-7.0 MPG), Local delivery (4.5-6.5 MPG depending on route density), Dump truck (3.5-5.5 MPG depending on off-road percentage), Refrigerated (0.5-1.0 MPG lower than dry van due to reefer unit fuel), Heavy haul/specialized (3.0-5.0 MPG). These averages vary significantly by terrain (mountain vs. flat), average load weight, and operational patterns. Rather than comparing to industry averages (which may not match your operation), benchmark within your fleet. Compare MPG between drivers on identical routes, identical vehicles, identical loads. The gap between your best and worst driver represents your achievable improvement potential. Most fleets find 15-25% MPG spread between top and bottom quartile drivers.
Q: How do I get drivers to embrace fuel efficiency rather than resist?
Driver resistance to fuel efficiency programs typically stems from three sources: 1) Fear that efficiency reduces earnings (if paid by mile), 2) Belief that efficiency slows them down (affecting schedules and quality of life), 3) Resistance to being "monitored." Address each concern directly. For earnings: adjust compensation to remove disincentives or add fuel bonuses that increase earnings for efficient driving. For schedule concerns: prove that efficient speeds add minimal time (30 minutes per 300 miles) and build buffer time into schedules. For monitoring: position telematics as coaching tools, not punitive surveillance. Share aggregate data showing savings. Recognize efficient drivers publicly. Create fuel efficiency competitions with meaningful rewards. Most drivers want to do a good job—show them how fuel efficiency makes them better professionals. When drivers see the financial and recognition benefits, resistance typically converts to enthusiasm.
Q: Is fuel efficiency still important with lower fuel prices?
Fuel efficiency is critically important regardless of fuel price. While high fuel prices make savings more obvious, low prices create even greater competitive advantage. When fuel prices drop, less-efficient competitors reduce their rates less than efficient carriers, allowing efficient fleets to maintain margins or gain market share. Additionally, fuel prices are cyclical—efficiency investments made during low-price periods deliver even larger savings when prices inevitably rise. The most successful fleets treat fuel efficiency as a permanent operational focus, not a response to price spikes. Furthermore, fuel efficiency correlates strongly with other operational efficiencies: reduced idle time improves asset utilization, smooth driving reduces maintenance, route optimization improves customer service. Even at $2.50/gallon, a 1 MPG improvement on a 100,000-mile truck saves $3,570 annually—substantial money for almost any fleet.
Q: How does electric vehicle adoption affect fuel efficiency strategies?
Electric vehicles (EVs) change the specific strategies but not the importance of efficiency. For EV fleets, "fuel" cost becomes electricity cost, typically $0.15-0.30 per mile equivalent versus $0.40-0.60 for diesel. However, efficiency remains crucial because: 1) Electric range is limited—efficiency directly determines usable range per charge, 2) Charging infrastructure costs are high—efficiency reduces required infrastructure investment, 3) Electricity costs vary by time-of-use—efficiency maximizes value of off-peak charging. EV-specific efficiency strategies include: regenerative braking optimization (maximizes energy recovery), cabin climate preconditioning while plugged in (reduces battery drain during driving), route planning that considers charging locations, and driver training on EV-specific techniques (one-pedal driving, coasting regeneration). Many behavioral strategies (smooth acceleration, reduced speed, anticipating traffic) apply to both diesel and electric vehicles. The most important EV efficiency metric is miles per kilowatt-hour (mi/kWh)—target 2.0+ for heavy trucks, 3.0+ for medium-duty, 4.0+ for light-duty.







