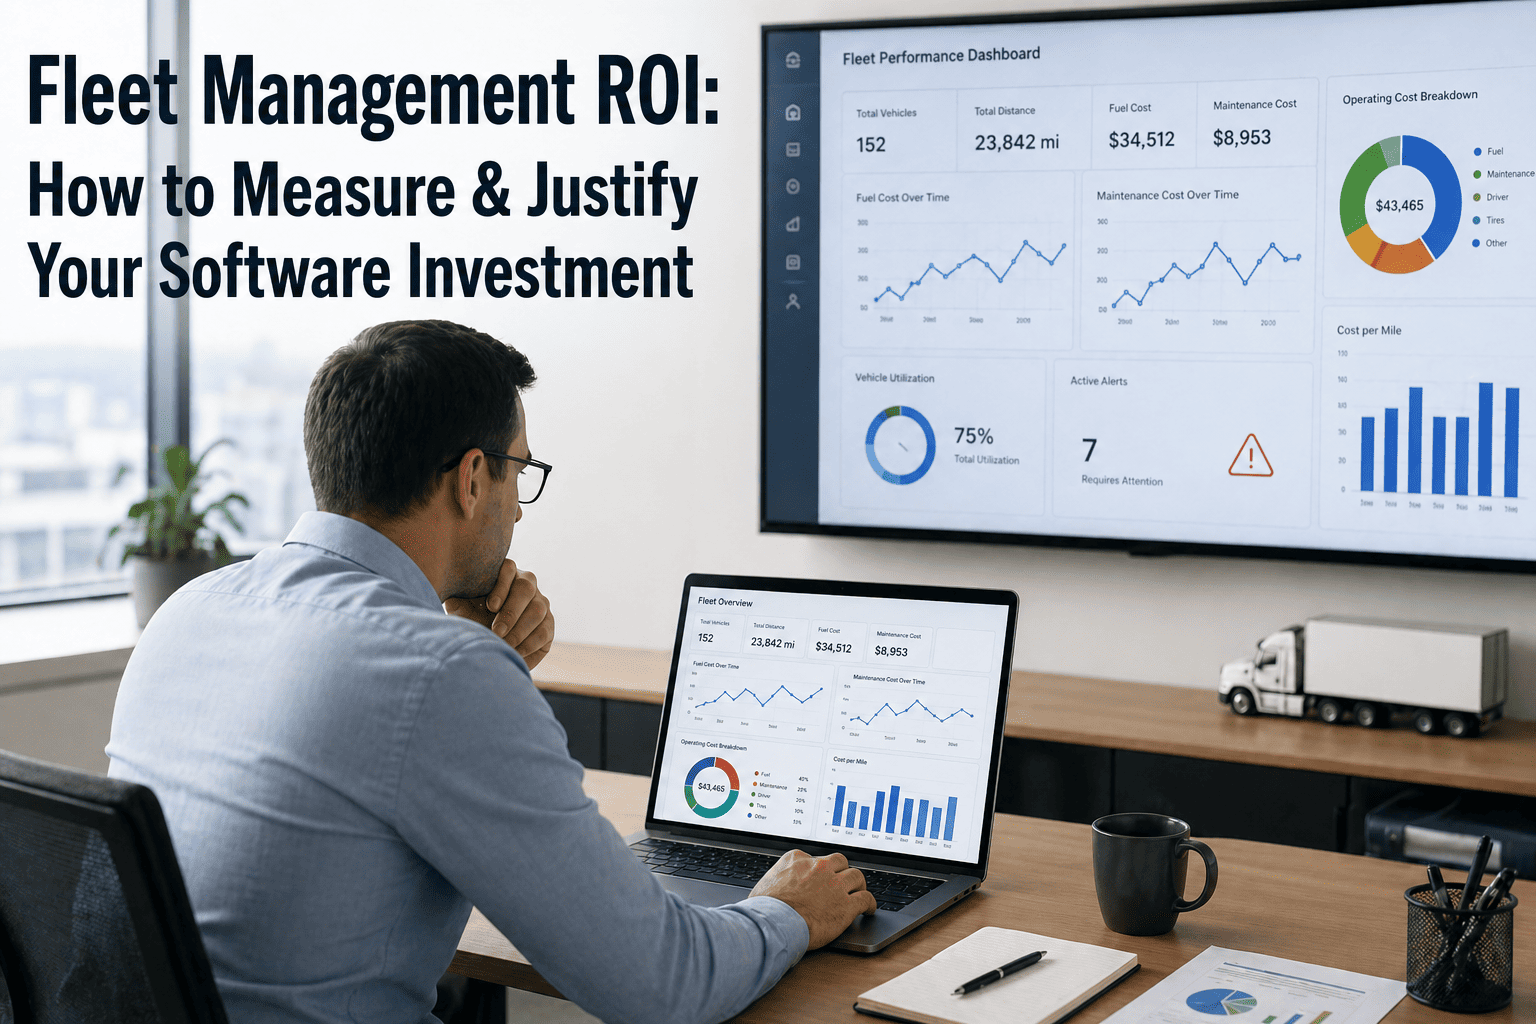
Fleet management software represents a significant operational investment. Fleet managers and financial officers evaluating software platforms face a common challenge — building a credible business case that captures the full range of cost savings and efficiency gains while accounting for implementation costs and operational disruption risk. The difference between a rejected proposal and approved investment often comes down to how well the ROI calculation accounts for both the quantifiable savings and the harder-to-measure risk reduction and compliance benefits. This guide provides a structured framework for calculating fleet management software ROI, identifying cost savings categories, building a financial business case, and presenting the investment justification to stakeholders who may not have operational fleet backgrounds.
Fleet Analytics
Financial Planning
Medium Priority
10 min read
Guide Overview
This guide provides a complete framework for calculating fleet management software ROI — including quantifiable cost savings categories, implementation cost accounting, payback period calculation, and presentation strategies for financial stakeholders. FleetRabbit's analytics module provides the baseline data fleet managers need to build accurate ROI models based on actual operational performance rather than industry averages.
8-12
months average payback period for fleet management software investment in mid-size commercial fleets
15-25%
typical fuel cost reduction from route optimization and driver behavior monitoring
20-30%
reduction in maintenance costs through preventive scheduling and defect-to-work order automation
3-5%
increase in fleet utilization through improved vehicle assignment and dispatch visibility
Understanding Fleet Management Software ROI Components
Fleet management software ROI is not a single number — it is the sum of multiple cost reduction and efficiency improvement streams that compound across operational areas. Fleet managers who capture the full range of these benefits build significantly stronger business cases than those who focus narrowly on fuel savings or maintenance cost reduction alone.
The total ROI of fleet management software typically comes from five primary categories: fuel cost reduction through route optimization and driver behavior management, maintenance cost reduction through preventive scheduling and defect tracking, labor efficiency gains from reduced administrative work, utilization improvements that reduce fleet size requirements, and risk reduction that lowers accident costs and compliance penalties. Each category contributes differently based on fleet type, operating profile, and current management practices.
Primary ROI Driver
Fuel Cost Reduction
Fuel is typically the largest variable operating expense for commercial fleets, representing 25 to 40 percent of total operating costs. Fleet management software reduces fuel consumption through multiple mechanisms — route optimization that eliminates unnecessary miles, driver behavior monitoring that reduces harsh acceleration and excessive idling, and vehicle assignment that matches the right vehicle to each route based on efficiency characteristics. Combined fuel savings of 10 to 20 percent are achievable for fleets without existing optimization programs, representing thousands of dollars per vehicle annually.
Primary ROI Driver
Maintenance Cost Reduction
Unscheduled repairs cost more than scheduled maintenance. Preventive maintenance enforcement through automated scheduling reduces breakdown frequency and extends component life. Defect-to-work order integration eliminates the delay between problem identification and repair, preventing minor issues from becoming major failures. Fleets implementing comprehensive maintenance management typically see 15 to 25 percent reduction in maintenance cost per mile within the first year.
Primary ROI Driver
Labor Efficiency Gains
Fleet management software reduces administrative labor across multiple roles — drivers spend less time on inspection paperwork, shop supervisors spend less time on manual work order tracking, fleet managers spend less time compiling compliance reports and manually calculating metrics. For a fleet of one hundred vehicles, administrative time savings alone can justify the software investment while the larger cost savings categories contribute additional ROI.
Primary ROI Driver
Utilization and Asset Optimization
Many fleets operate more vehicles than necessary because they lack visibility into actual utilization. Fleet management software provides usage data that identifies underutilized vehicles, enabling fleet reduction through reassignment or disposal. Reducing fleet size by five to ten percent through better utilization delivers savings in acquisition cost, insurance, registration, and ongoing maintenance that compound annually.
Quantifiable Cost Savings Categories in Fleet Management Software
Building a credible ROI model requires identifying specific cost savings categories and attaching realistic improvement assumptions based on fleet-specific baseline data. The sections below detail the primary savings categories with typical improvement ranges and calculation methodologies.
01
Fuel Savings Through Route Optimization
Route optimization reduces total miles driven, idle time, and inefficient routing patterns. Typical fuel savings range from 8 to 15 percent for fleets without existing route planning tools. Calculation methodology: baseline annual fuel spend multiplied by expected percentage reduction. For a fleet spending $500,000 annually on fuel, a 10 percent reduction delivers $50,000 in annual savings.
02
Fuel Savings Through Driver Behavior
Driver behavior monitoring and coaching reduces fuel consumption from harsh acceleration, speeding, and excessive idling. Typical savings range from 5 to 12 percent for fleets without active driver management programs. Calculation methodology: baseline fuel spend multiplied by expected behavior-driven reduction, additive to route optimization savings in most fleets.
03
Preventive Maintenance Compliance Savings
Automated preventive maintenance scheduling reduces breakdown frequency and extends component life. Typical savings range from 10 to 20 percent of total maintenance spend. Calculation methodology: baseline annual maintenance cost per vehicle multiplied by expected percentage reduction, applied across the fleet.
04
Defect-to-Repair Efficiency
Digital inspection and automated work order creation reduce the time between defect identification and repair, preventing minor issues from becoming major failures. Typical savings range from 5 to 15 percent of major repair spend. Calculation methodology: baseline major repair cost multiplied by expected reduction from earlier intervention.
05
Administrative Labor Reduction
Fleet management software eliminates manual data entry, paper form processing, and report compilation. Typical savings range from 10 to 30 hours per week for fleet administrator positions. Calculation methodology: hours saved multiplied by fully burdened labor rate, annualized.
06
Compliance and Audit Cost Reduction
Digital compliance records reduce audit response time and eliminate lost or illegible form penalties. Savings include reduced staff time for audit preparation and avoided compliance fines. Calculation methodology: estimated audit preparation hours multiplied by labor rate plus historical compliance penalty average.
Calculate Your Fleet's Software ROI with FleetRabbit
FleetRabbit's analytics module provides the baseline data you need to build accurate ROI models based on your fleet's actual performance metrics. Start a free trial to access your fleet's cost data.
Building the Fleet Management Software ROI Model
A credible ROI model requires structured calculation across three time horizons — initial implementation period, first-year operations, and ongoing annual value. The model should account for implementation costs, projected savings, payback period, and five-year net present value for financial stakeholders who evaluate investments on long-term return.
Step 1
Establish Baseline Performance Metrics
ROI calculations are only as accurate as the baseline data they build upon. Before projecting savings, establish current performance metrics for each cost category — fuel cost per mile or per kilometer, maintenance cost per mile, administrative hours spent on fleet tasks, vehicle utilization rates, and compliance violation history. Fleets without existing telematics or fleet management systems may need to collect baseline data manually over a representative period. FleetRabbit provides baseline reporting for fleets migrating from manual systems, establishing historical benchmarks during the initial data entry phase.
Fuel cost per mile documented
Maintenance cost per mile documented
Administrative hours quantified
Step 2
Calculate Implementation and Subscription Costs
Total software investment includes subscription fees, implementation and setup costs, training expenses, and any hardware or telematics device purchases required. Subscription fees are typically calculated monthly or annually per vehicle. Implementation costs may include data migration, system configuration, and integration with existing systems. Training costs include staff time for training sessions and potential temporary coverage during training periods. FleetRabbit's transparent pricing model includes standard implementation support with no hidden setup fees for typical deployments.
Annual subscription cost calculated
Implementation budget defined
Training cost estimated
Step 3
Project Annual Savings by Category
Apply conservative improvement assumptions to each savings category based on fleet-specific baseline metrics and software capabilities. Use ranges rather than single-point estimates to account for implementation uncertainty. For each category, calculate low-range, expected, and high-range savings projections. The expected projection should be used for primary ROI calculation, with low and high ranges presented as sensitivity analysis for financial stakeholders who request confidence intervals on investment returns.
Fuel savings projected
Maintenance savings projected
Labor savings projected
Step 4
Calculate Payback Period and Long-Term ROI
Payback period is calculated as total implementation and first-year subscription cost divided by first-year projected savings. A payback period under twelve months is generally considered strong for fleet management software investments. Long-term ROI should be calculated over a three to five year horizon, accounting for subscription costs continuing while savings accumulate annually. Net present value calculations may be required for larger fleets presenting to corporate finance teams with discounted cash flow requirements.
Payback period calculated
Three-year ROI projected
Five-year NPV calculated
Step 5
Present Business Case to Stakeholders
Translate the ROI model into a presentation tailored to stakeholder priorities. Financial stakeholders focus on payback period, net present value, and internal rate of return. Operations stakeholders focus on efficiency gains, downtime reduction, and driver satisfaction improvements. Compliance stakeholders focus on audit readiness, penalty reduction, and safety metrics. The most effective business cases combine quantified financial returns with operational and risk reduction benefits that may not appear directly in the ROI calculation.
Financial case documented
Operational benefits articulated
Risk reduction quantified
ROI Case Study: 100-Vehicle Delivery Fleet
The following case study demonstrates ROI calculation for a representative mid-size fleet. Individual fleet results vary based on baseline performance, implementation effectiveness, and operating profile. Fleet managers should build models based on their specific data rather than adopting industry averages without adjustment.
Fleet Profile
100 light to medium duty delivery vehicles operating urban and suburban routes. Annual fuel spend: $600,000. Annual maintenance spend: $400,000. Fleet administration: two full-time equivalents focused on maintenance scheduling, compliance documentation, and reporting. No existing fleet management software — manual processes for inspections, maintenance tracking, and route planning.
Implementation Costs
Annual software subscription at $15 per vehicle per month: $18,000. Telematics device purchase and installation for vehicles without existing hardware: $12,000 one-time. Staff training and implementation support: estimated 80 hours at $40 per hour including overtime coverage: $3,200. Total first-year cost including subscription and one-time expenses: $33,200.
Projected Annual Savings
Fuel savings from route optimization and driver behavior: 12 percent of $600,000 equals $72,000. Maintenance savings from preventive compliance and defect automation: 15 percent of $400,000 equals $60,000. Administrative labor reduction: 1.5 FTEs at $60,000 fully burdened equals $90,000. Total projected annual savings: $222,000.
ROI Results
Net first-year savings after implementation costs: $222,000 minus $33,200 equals $188,800. Payback period: $33,200 divided by $18,500 average monthly savings equals 1.8 months. Three-year ROI assuming flat subscription costs and conservative 5 percent annual savings increase: cumulative savings of $710,000 against cumulative costs of $54,000 equals 1,214 percent return.
ROI By Fleet Type: Variation Across Operating Profiles
ROI from fleet management software varies significantly by fleet type, operating profile, and current management practices. The table below illustrates typical ROI drivers and expected payback periods for common fleet categories.
Fleet Type
Primary ROI Drivers
Typical Payback
Last-Mile Delivery
Route optimization fuel savings, driver behavior, utilization improvement
3 to 6 months
Long-Haul Trucking
Fuel efficiency, driver behavior, compliance and hours tracking
6 to 12 months
Construction and Heavy Equipment
Maintenance optimization, utilization improvement, idle reduction
8 to 14 months
Field Service Vehicles
Route optimization, idle reduction, maintenance scheduling
4 to 8 months
Government and Municipal
Maintenance optimization, utilization improvement, compliance documentation
10 to 16 months
Mixed Propulsion Diesel-Electric
Unified fleet management, EV-specific analytics, charging optimization
6 to 10 months
Get Fleet-Specific ROI Projections for Your Operation
FleetRabbit provides customized ROI analysis based on your fleet size, vehicle types, and current operating metrics. Book a demo to receive a fleet-specific ROI projection for your software investment.
Beyond Quantifiable Savings: Value Categories Often Missed in ROI Models
Quantifiable savings categories capture the majority of fleet management software ROI, but they do not capture the full value. Fleet managers who include the following categories in their business cases present a more complete picture of investment value to decision-makers.
Risk Reduction Value
Accident Cost Avoidance
Driver behavior monitoring reduces accident frequency through coaching and intervention. The average commercial vehicle accident costs tens of thousands of dollars in repairs, downtime, insurance increases, and potential liability. Even a single avoided accident annually represents significant value that does not appear in standard ROI calculations but is real and material to fleet financial performance.
Risk Reduction Value
Compliance Penalty Avoidance
Automated compliance documentation eliminates missing or incomplete inspection records that generate fines during roadside audits and facility inspections. Fleets operating in regulated environments with frequent inspections or high audit risk should quantify historical penalty costs and project avoidance as part of the business case.
Strategic Value
Shipper Contract Retention
Major shippers increasingly require sustainability reporting, compliance documentation, and performance data from logistics partners. Fleet management software provides the data infrastructure required to retain contracts with shippers who have digital reporting requirements. The value of contract retention far exceeds direct software savings in many cases.
Strategic Value
Driver Retention and Recruitment
Driver preference for modern equipment and digital tools influences retention and recruitment in competitive driver markets. Fleets using modern fleet management software and digital inspection tools present a more professional image to drivers, reducing turnover costs that typically range from $5,000 to $15,000 per driver replacement.
Sustainability Value
Emissions Reduction Documentation
Corporate sustainability reporting requires emissions data that fleet management software provides automatically. Fleets that cannot produce emissions documentation face increasing pressure from shippers and regulators. The ability to document and report emissions reductions supports corporate sustainability goals and may qualify for carbon credit or incentive programs.
Sustainability Value
EV Transition Foundation
Fleets planning electric vehicle transitions need duty cycle data, route analysis, and charging management capabilities. Fleet management software provides the data foundation for EV transition planning. The value of having this infrastructure in place before EV procurement begins avoids transition delays and operational disruption that would otherwise increase transition costs.
Presenting Fleet Management Software ROI to Financial Stakeholders
Financial stakeholders — CFOs, finance directors, procurement managers — evaluate investment proposals differently than operations leaders. Successful presentations translate operational benefits into financial language while providing the documentation and confidence intervals that finance teams require for approval.
Lead with Payback Period
Financial stakeholders want to know when the investment returns capital. Lead with payback period in months, presented clearly and prominently. Sub-twelve-month payback periods are generally viewed favorably. If payback exceeds eighteen months, prepare additional justification for strategic or risk reduction value that offset the extended payback timeline.
Provide Conservative and Optimistic Scenarios
Single-point ROI estimates invite skepticism. Provide low-range, expected, and high-range projections with clear assumptions for each scenario. Financial stakeholders appreciate transparency about uncertainty and typically approve based on expected case while noting that upside exists beyond the baseline projection.
Show Baseline Data Sources
ROI projections based on unsupported assumptions will be rejected. Show the baseline data used for each calculation — fuel cost per mile reports, maintenance cost records, administrative time studies. If baseline data comes from manual collection, describe the methodology and period of collection. Credible baselines build credibility for projections.
Include Implementation Risk Mitigation
Financial stakeholders consider implementation risk alongside projected returns. Address risk directly in the presentation — describe the phased implementation approach, the pilot period that validates savings before full deployment, and the vendor support structure for issue resolution. A credible risk mitigation plan increases confidence in projected returns.
What Financial Executives Say About Fleet Software ROI
Our fleet manager came to us with a proposal that included fuel savings, maintenance reduction, and administrative efficiency. What convinced the finance committee was the accident avoidance data — the insurance cost reduction from driver behavior monitoring alone covered half the software cost before we even calculated the fuel and maintenance savings. The three-month payback period made the decision straightforward.
Chief Financial Officer
Regional Distribution Company, 85 vehicles
We require five-year net present value calculations for any software investment over fifty thousand dollars. The fleet management software proposal delivered a positive NPV in year one and cumulative NPV over five years that exceeded two hundred thousand dollars. The sensitivity analysis showed positive returns even in the low-case scenario. That level of financial rigor made approval easy.
Director of Financial Planning
National Logistics Provider, 450 vehicles
Frequently Asked Questions
How do I calculate ROI if my fleet does not have baseline performance data?
Fleets without existing baseline data should collect manual data for a representative period before building an ROI model. Collect fuel receipts and odometer readings for sixty to ninety days to establish cost per mile. Gather maintenance records for the previous twelve months to establish annual maintenance spend. If manual data collection is not feasible, use conservative industry averages with clear disclosure that projections are estimates pending baseline verification. FleetRabbit's free trial period includes baseline data collection tools that establish current performance metrics during the evaluation phase.
Book a demo to discuss baseline data collection for your fleet.
What is a realistic payback period for fleet management software?
Payback periods vary significantly by fleet type and current management practices. Well-managed fleets with existing optimization programs may see payback in twelve to eighteen months. Fleets currently operating with manual processes and no existing telematics typically achieve payback in three to nine months. The case study in this guide demonstrated 1.8 month payback for a fleet with no existing systems. The presence or absence of current optimization measures is the strongest predictor of payback timeline.
How should I account for staff time spent on software implementation in the ROI model?
Staff time spent on implementation should be included as a cost in the ROI model, typically valued at fully burdened labor rates including wages, benefits, and overhead. Include time for data gathering, system configuration, training attendance, and parallel process operation during the transition period. Most fleets budget 40 to 120 staff hours for comprehensive implementation depending on fleet size and process complexity. FleetRabbit's implementation support reduces internal staff time requirements through structured deployment assistance.
Book a demo to discuss implementation timelines and staff hour requirements for your fleet size.
Does fleet management software ROI decrease after the first year?
No. While year-one savings may be highest due to initial optimization gains, ongoing savings continue annually at levels typically 70 to 90 percent of first-year results. Subscription costs continue, but the cumulative ROI increases each year as savings compound. Most fleets find that cumulative five-year ROI significantly exceeds first-year ROI because the upfront implementation cost is amortized over more savings periods. The case study in this guide showed three-year ROI of 1,214 percent compared to first-year net savings of $188,800.
How does FleetRabbit's pricing compare to ROI potential?
FleetRabbit's subscription pricing is structured to deliver positive ROI within the first year for fleets of all sizes. Per-vehicle monthly fees start at levels where fuel savings from a single vehicle typically exceed the subscription cost for that vehicle within the first month of optimized routing. Larger fleets benefit from volume pricing tiers that reduce per-vehicle cost as fleet size increases. Fleet managers can request a fleet-specific ROI projection during the demo process that calculates estimated savings based on actual fleet data rather than generic assumptions.
Book a demo to receive a customized ROI projection for your fleet.
Build Your Fleet Software ROI Case with FleetRabbit
FleetRabbit provides the analytics, reporting, and cost tracking capabilities you need to calculate accurate ROI and justify your software investment to financial stakeholders.
ROI Calculator
Cost Analytics
Fuel Savings
Maintenance Optimization
Utilization Tracking
Compliance Reporting
April 29, 2026
By Jason Smith
All Posts