Every minute a vehicle leaves its assigned zone without a triggered alert, your fleet is operating blind. Traditional geofencing draws a box on a map and fires a notification after a driver has already crossed the boundary — reactive, too late, and often ignored because of alert fatigue from false positives. FleetRabbit's AI geofencing layer does something different: it learns your fleet's normal movement patterns, predicts deviations before they become violations, and sends intelligent alerts to the right person with enough lead time to actually act. Book a free demo to see AI geofencing live on your fleet routes →
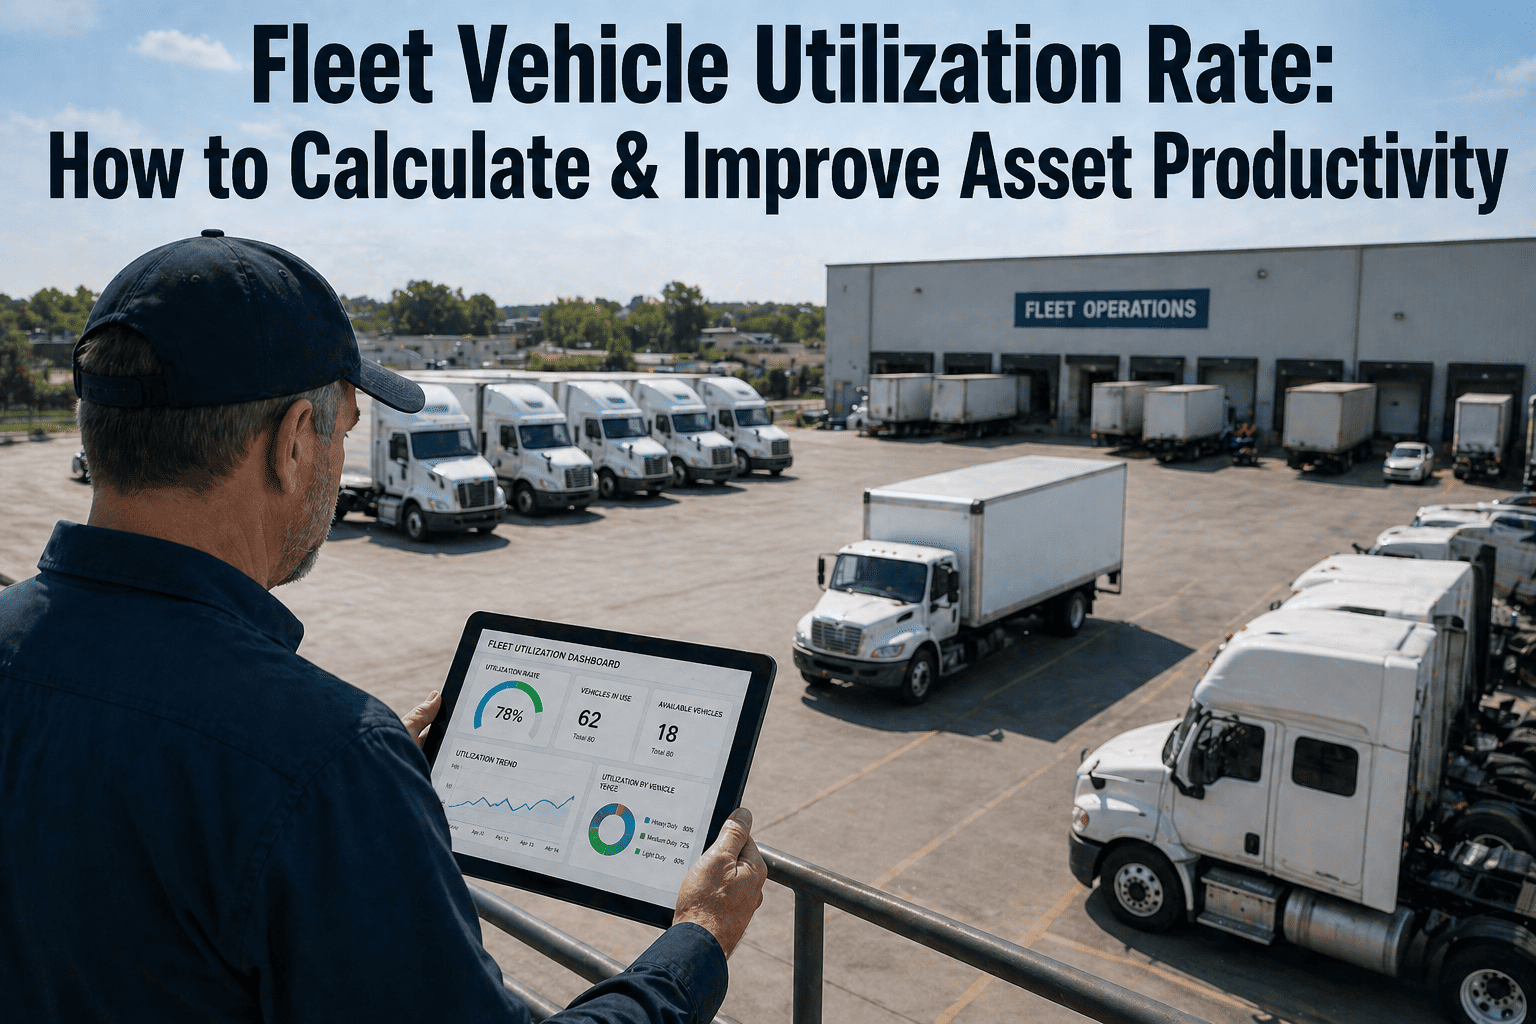
Fleet utilization rate measures how effectively your vehicles are being used versus sitting idle. Calculate by dividing active hours by total available hours. Industry best-in-class fleets achieve 75-85% utilization. Low utilization directly increases cost per mile and extends asset payback periods. FleetRabbit's AI geofencing helps identify underused vehicles and optimize deployment automatically.
Why Fleet Utilization Rate Matters More Than Headcount
Most fleet managers track vehicle count, maintenance schedules, and driver logs. But without utilization data, you don't know which assets are earning and which are just burning fuel. A vehicle that sits idle for 60% of its available hours still requires insurance, registration, maintenance reserves, and garage space — costs that add up whether the wheels turn or not. Fleet utilization rate reveals the gap between what you pay for and what you actually use. Start free and track your fleet's real utilization in under 10 minutes →
How to Calculate Fleet Utilization Rate: Two Methods
Different fleet types require different utilization metrics. A last-mile delivery fleet measures utilization differently than a construction fleet with seasonal equipment. FleetRabbit's AI geofencing layer calculates both methods automatically from GPS telemetry, giving you utilization data without manual spreadsheets. See live utilization dashboards for your fleet — book a 30-minute walkthrough →
Time-based utilization measures how many hours a vehicle operates relative to the total hours it could operate. For a vehicle available 10 hours per day (7 AM to 5 PM) that actively runs for 7.5 hours, utilization would be 75 percent. This method works best for fleets with defined operational windows — delivery, service, and passenger transport. FleetRabbit calculates active hours automatically from ignition status and movement detection, eliminating manual time log entry. The system distinguishes between driving time, on-site idle time, and pure parked idle, giving you granular visibility into how those active hours break down.
Distance-based utilization compares actual miles driven against a target benchmark — either the fleet average miles per available hour or a route-specific target. A vehicle that drives 120 miles daily in a fleet averaging 160 miles per day would show 75 percent distance-based utilization. This method works best for fleets where miles correlate directly with revenue — long-haul trucking, bulk delivery, and any operation billing by the mile. FleetRabbit calculates distance-based utilization automatically from odometer telemetry and compares each vehicle against configurable targets or rolling fleet averages.
For most mixed fleets, neither time-based nor distance-based utilization tells the full story alone. A vehicle that runs 9 hours but covers only 80 miles (low speed, high idle) needs different management than a vehicle that runs 4 hours but covers 200 miles (high speed, short window). FleetRabbit's combined asset utilization score weights both dimensions equally or with configurable weighting based on your fleet's priorities. Vehicles below the configurable threshold (default 60 percent) surface automatically as candidates for redeployment, sale, or driver retraining.
Raw utilization numbers don't tell you what good looks like. FleetRabbit's AI benchmarking layer compares each vehicle's performance against three reference points: the fleet average (internal competition), vehicles in similar duty cycles (apples-to-apples comparison), and anonymized industry benchmarks from fleets of comparable size and type. A vehicle running 55 percent utilization might be a problem — unless the fleet average is 48 percent and the industry benchmark for that asset class is 52 percent. Benchmarking adds context to raw numbers, helping managers prioritize interventions where the gap between current and potential utilization is largest.
Automatic time-based and distance-based utilization tracking, AI-powered benchmarking against fleet and industry peers, and low-utilization alerts — free for up to 3 vehicles. No hardware. No contracts. Live in 48 hours.
7 Proven Strategies to Improve Fleet Utilization Rate
Low utilization is rarely a single problem. It's usually a combination of scheduling gaps, route inefficiency, hidden idle time, and asset misalignment. These seven strategies target specific utilization leaks. Each strategy requires different data inputs — FleetRabbit's AI geofencing provides all of them automatically. Connect your fleet and start measuring utilization against these benchmarks today →
Identify and Remove Underutilized Assets
Review utilization data quarterly and flag vehicles consistently below 50 percent utilization across both time-based and distance-based metrics. For each flagged vehicle, assess three options: redeploy to a higher-demand route, reassign to a different driver or shift, or sell and replace with a shared or on-demand asset. Fleets that conduct quarterly utilization reviews reduce fleet size by 8-12 percent while maintaining or increasing delivered volume, lowering total cost per delivery.
Reduce Excessive Idle Time Through Alerts
Idle time longer than five minutes at non-delivery locations is usually wasted — not traffic, not waiting, not customer service. Set idle alerts at 10 minutes, 15 minutes, and 20 minutes. Use the first alert as a reminder, the second for driver check-in, and the third for supervisor review. Construction fleets reduce idle time by 18 percent within 60 days of implementing tiered idle alerts, saving an average of 240 idle hours per vehicle annually.
Implement Shift-Based Utilization Targets
Different shifts have different utilization baselines. Morning delivery windows might achieve 85 percent utilization; afternoon windows might drop to 55 percent due to lighter loads and earlier cutoffs. Set separate utilization targets per shift and per route type rather than applying a blanket target across all vehicles. When afternoon shifts consistently underperform, investigate route density, stop spacing, and dispatch timing before assuming driver or vehicle issues.
Optimize Route Density by Utilization Data
Vehicles with high time-based utilization but low distance-based utilization are spending too much time covering too few miles — usually due to poor route density or excessive stops per mile. Use utilization data to identify these vehicles, then review their routes for unnecessary waypoints, inefficient sequencing, or overlapping coverage. Route optimization based on utilization patterns typically recovers 1.5-2 hours per vehicle per week without adding stops.
Schedule Maintenance Based on Actual Use
Vehicles with low utilization don't need maintenance at the same frequency as high-utilization vehicles. Use utilization data to segment maintenance schedules by actual engine hours or miles rather than calendar days. A construction vehicle that runs 300 hours annually doesn't need oil changes every three months — it needs them every 150 operating hours. Utilization-based maintenance lengthens service intervals for underused assets and shortens them for high-use assets, reducing both over-maintenance waste and under-maintenance risk.
AI-Based Utilization Forecasting
Historical utilization data predicts future needs. FleetRabbit's AI layer analyzes three years of utilization patterns by day of week, month, and route type to forecast when utilization will peak and when vehicles will sit idle. Use these forecasts to schedule preventive maintenance during predictable idle windows, arrange seasonal vehicle rentals instead of permanent additions, and identify which underutilized vehicles can be sold before seasonal demand drops further.
Driver-Led Utilization Improvement Programs
Drivers see utilization problems that managers don't — inefficient stop sequences, unnecessary waiting time, equipment that's the wrong size for the load. Share weekly utilization scores with drivers and ask for input on what's causing low time. Fleets that implement driver-led utilization reviews identify 3-5 actionable improvements per quarter per route, with 70 percent of driver suggestions directly reducing idle time or increasing productive miles.
Fleet manager pulls odometer readings from monthly inspections, enters them into a spreadsheet, and calculates average miles per vehicle. The calculation takes three hours each month. Results show fleet average utilization at 62 percent — but the manager can't see which vehicles are driving the average down. Two months later, a quarterly review reveals three vehicles haven't exceeded 40 percent utilization in six months. Combined cost of those underutilized assets: $18,000 in unnecessary depreciation, insurance, and maintenance reserves. The data existed but wasn't surfaced in time to act.
Real-time utilization dashboard updates automatically from GPS telemetry. Vehicle 417 shows time-based utilization at 41 percent for three consecutive weeks — below the 60 percent threshold. Automated alert triggers to fleet manager on week three, not month six. Manager reviews vehicle 417's route data, discovers the assigned route volume dropped 30 percent after a customer closed a facility. Vehicle redeployed to a different route within 48 hours. Utilization climbs to 71 percent. Total uncovered cost before action: zero. Total management time: 12 minutes.
Driver takes 15-minute breaks between deliveries, plus a 30-minute lunch, plus 20 minutes of waiting at the warehouse each morning. Total daily idle time: 65 minutes. Multiply by 22 working days per month: 23.8 idle hours monthly. At $4.50 per idle hour for fuel and engine wear, each vehicle wastes $107 monthly. For a 50-vehicle fleet: $5,350 monthly or $64,200 annually in pure idle waste — money paid for zero productive output. Without per-vehicle idle tracking, the waste is invisible and therefore uncorrected.
Idle alerts configured at 10 minutes, 15 minutes, and 20 minutes. First week: fleet average idle per vehicle drops from 65 minutes to 48 minutes daily. Second week: new average of 39 minutes. Third week: 32 minutes. By month two, fleet idle averages 28 minutes daily — a 57 percent reduction from baseline. Annual idle waste for the same 50-vehicle fleet drops from $64,200 to $27,600. Total savings: $36,600 annually. No capital investment. No driver confrontation. Just visibility creating accountability.
Every vehicle in your fleet, every idle minute captured, every underutilized asset flagged before it costs you another month of waste. FleetRabbit's AI utilization platform is live in your fleet in 48 hours, free for up to 3 vehicles, and pays for itself the first time it surfaces a vehicle you should sell and a route you should optimize.
Frequently Asked Questions About Fleet Utilization Rate
Fleet utilization rate reveals the gap between what you pay for and what you actually use. FleetRabbit's AI platform tracks time-based and distance-based utilization automatically, benchmarks against industry peers, and alerts you when vehicles fall below threshold. Free for up to 3 vehicles. No hardware required. Live in 48 hours.







