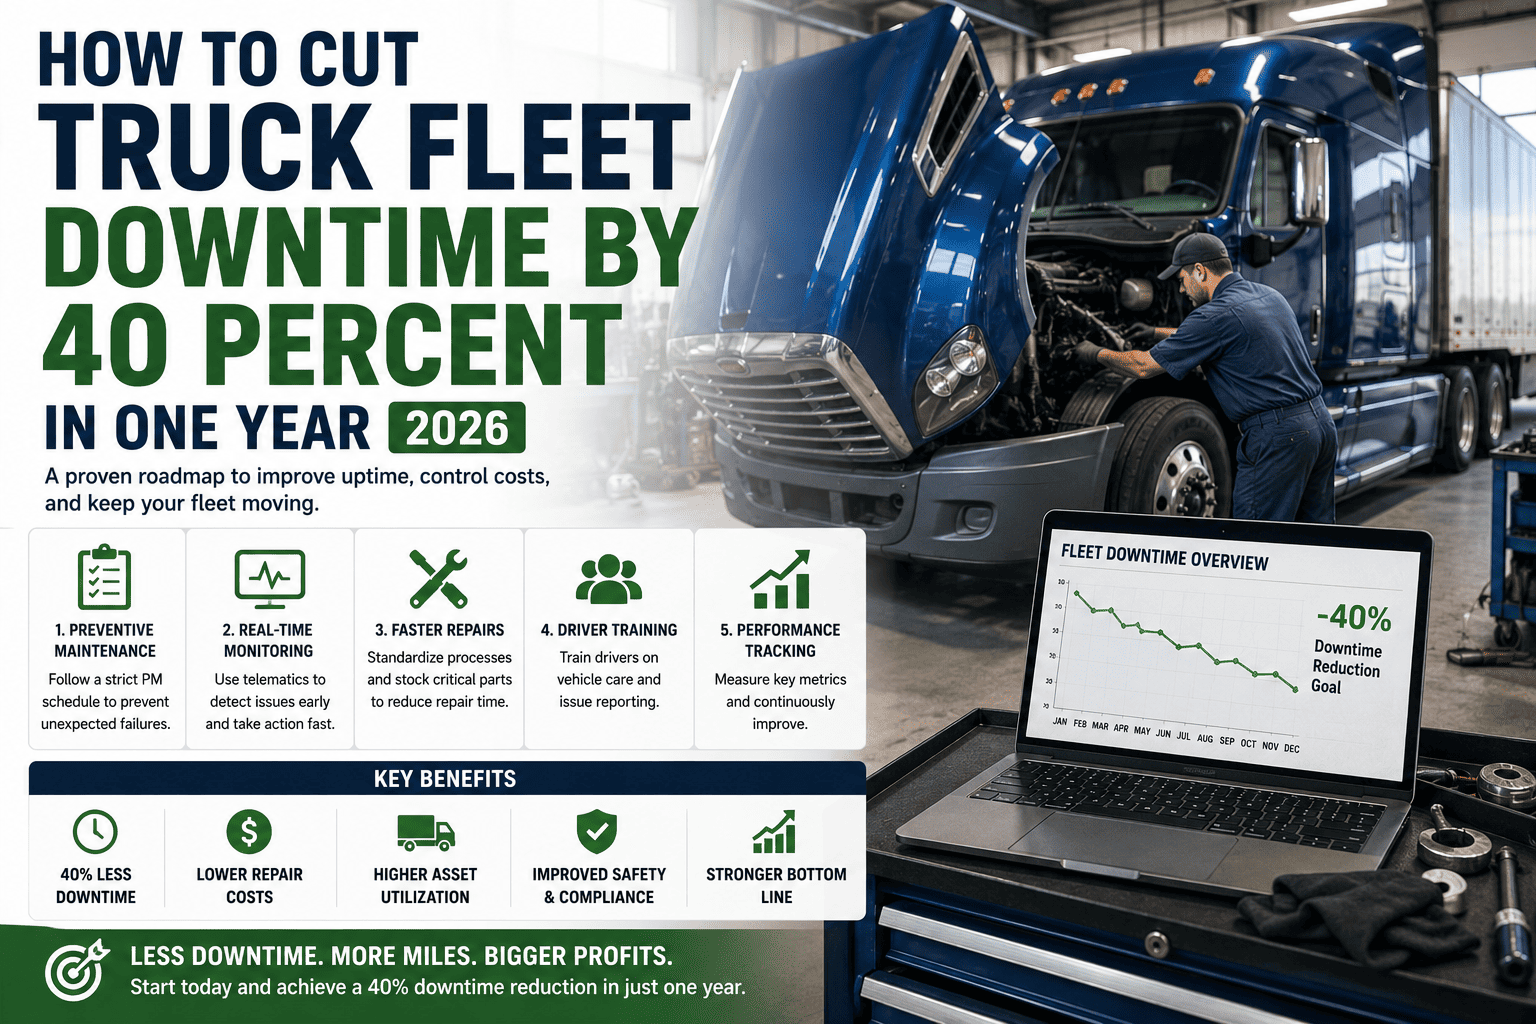
Most fleet managers don't lose sleep over the truck that just broke down. They lose sleep over the five trucks that will break down next month, and nobody knows which ones. That uncertainty is the real cost of downtime: not just the repair bill, but the constant guessing game that keeps your maintenance team reactive instead of in control. The good news is that cutting downtime by 40 percent isn't a moonshot. It's a documented, repeatable outcome that fleets of every size are already hitting in 2026.
Fleets that combine predictive maintenance, digital inspections, and a planned-versus-unplanned tracking discipline cut unplanned downtime by 30 to 50 percent within 12 months. The fastest path to sign up for a free trial and start collecting predictive alerts within 72 hours, letting you catch failing components 2 to 4 weeks before they strand a truck.
Why Downtime Keeps Creeping Back Up
Every fleet manager already runs some kind of maintenance program, yet unplanned downtime keeps eating into the schedule year after year. The reason is almost always the same: maintenance is reactive rather than predictive. A truck gets serviced on a calendar interval whether it needs it or not, while a slow-building brake or transmission fault goes undetected until it fails on the road. That single miss is expensive far beyond the repair invoice.
The 5-Step Framework To Cut Downtime By 40%
There's no single silver bullet, but there is a proven sequence. Fleets that hit the 40 percent mark almost always follow the same five moves, in roughly the same order. Skipping steps is the most common reason downtime reduction stalls out around 10 to 15 percent instead of reaching its full potential.
Step 1: Build A Real Downtime Baseline
You cannot cut what you haven't measured. Pull the last 12 months of maintenance records and separate every incident into planned and unplanned categories. Note the duration, the repair cost, and the revenue that vehicle would normally generate during that window. Most fleet managers are surprised to find their actual downtime cost runs 50 to 100 percent higher than their gut estimate once towing, overtime, and route disruption are included.
Step 2: Digitize Inspections So Nothing Slips Through
Paper checklists lose defects between the driver's clipboard and the shop's whiteboard. Digital pre-trip and post-trip inspections with photo attachments and automatic work-order creation close that gap immediately. This single change is typically the fastest payback in the entire framework, often 60 to 90 days, because it stops small defects from turning into roadside failures.
Step 3: Connect Telematics To A Predictive Model
This is where the biggest gains live. Modern telematics already stream engine temperature, brake wear, transmission pressure, and fault codes from most trucks built after 2015. Feeding that data into a predictive maintenance model lets you catch abnormal patterns, like a component behaving differently than its own history, 2 to 4 weeks before failure. If you're ready to see this in action, you can start a free trial and begin generating failure predictions within about 72 hours of connecting your data.
Step 4: Shift From Calendar Maintenance To Condition-Based Maintenance
Not every vehicle needs the same strategy. High-utilization trucks and critical components deserve predictive monitoring, while low-mileage or backup vehicles can stay on simple calendar intervals. This hybrid approach, used by the majority of leading fleets in 2026, avoids over-servicing healthy parts while still catching the failures that matter most.
Step 5: Track The Ratio, Not Just The Incidents
The clearest signal that your program is working isn't the number of breakdowns, it's the ratio of planned to unplanned maintenance. A healthy fleet runs 80 to 90 percent planned maintenance. If you're closer to 50-50, that gap is exactly where your 40 percent improvement is waiting to be captured.
FleetRabbit connects to the telematics you already have and starts building vehicle-specific baselines within 24 hours. Most customers see a measurable drop in unplanned breakdowns inside the first 30 days, with predictions accurate enough to schedule repairs before a truck ever misses a route.
Reactive Vs. Predictive: What Actually Changes
The table below compares the same repair event handled two different ways. The dollar gap is the entire business case for moving away from a purely reactive shop.
| Factor | Reactive (Unplanned) | Predictive (Planned) |
|---|---|---|
| Repair Cost | 3 to 5 times higher due to overtime labor and rush parts | Standard shop rate, parts ordered in advance |
| Repair Duration | Averages 4.3 days, up 31 percent since 2022 | Scheduled window, often same-day |
| Detection Timing | After the failure, often on the road | 2 to 4 weeks before failure occurs |
| Route Impact | Missed delivery windows, driver reassignment | Maintenance slotted into low-demand periods |
| Typical ROI Window | None, cost keeps compounding | 3 to 12 months on the platform investment |
Your 12-Month Rollout Timeline
Fleets that hit 40 percent don't try to fix everything at once. They move through four phases, expanding coverage as the data proves itself.
Weeks 1 to 4: Baseline And Pilot
Audit last year's downtime records and connect telematics on your highest-risk 15 to 25 percent of vehicles, usually the highest-mileage or highest-value trucks. This is also when digital inspections should go live fleet-wide, since that change requires no hardware and pays back the fastest.
Weeks 5 to 12: Validate The Predictions
Compare AI-flagged alerts against actual shop findings. Early-stage models typically run 75 to 80 percent accurate and climb toward 90 percent as they learn your fleet's specific patterns. Use this window to tune alert thresholds so your team trusts the signal instead of tuning it out.
Month 4 to Month 6: Expand Coverage
Roll predictive monitoring out to the rest of the fleet, and start shifting low-utilization vehicles onto simple calendar maintenance to keep the program lean. This is the point where most fleets cross into positive ROI, with the first prevented major failure often paying for the entire platform.
Month 7 to Month 12: Lock In The Gains
Track your planned-to-unplanned ratio monthly and report the recovered revenue back to leadership. Fleets that stay disciplined here are the ones documenting the full 30 to 50 percent downtime reduction rather than plateauing early. If you want a team to walk through your specific numbers, you can book a demo and get a rollout plan sized to your fleet.
Metrics That Prove The Program Is Working
Three numbers tell you almost everything about how a downtime reduction program is performing. Watch them monthly, not annually, so problems surface while they're still small.
Vehicle Uptime Percentage
Target 95 to 98 percent depending on fleet type. Anything consistently below that threshold on a specific vehicle points to a chronic issue worth a deeper inspection.
Mean Time Between Failures
This should climb steadily as predictive maintenance catches issues earlier. A fleet moving from reactive to predictive maintenance typically sees this metric improve 40 to 60 percent within the first year.
Planned Vs. Unplanned Ratio
The single clearest health check for the whole program. Moving from a 50-50 split toward an 80-20 or 90-10 split is, in practice, the same thing as hitting your 40 percent downtime reduction target.
A short call with FleetRabbit's team will map this framework onto your actual fleet size, vehicle mix, and current maintenance ratio, so you leave with a realistic 12-month target instead of a generic benchmark.
Frequently Asked Questions
The Bottom Line
Cutting downtime by 40 percent doesn't require replacing your entire tech stack or overhauling your maintenance team overnight. It requires a baseline, a predictive data feed, and the discipline to track your planned-to-unplanned ratio every month until it moves. Fleets that follow this sequence are documenting real, repeatable results in 2026, not theoretical projections.
Every week without predictive visibility is another week of paying the reactive maintenance tax. Connect your fleet, start seeing failure predictions within days, and put your downtime number on a downward trend instead of an upward one.







