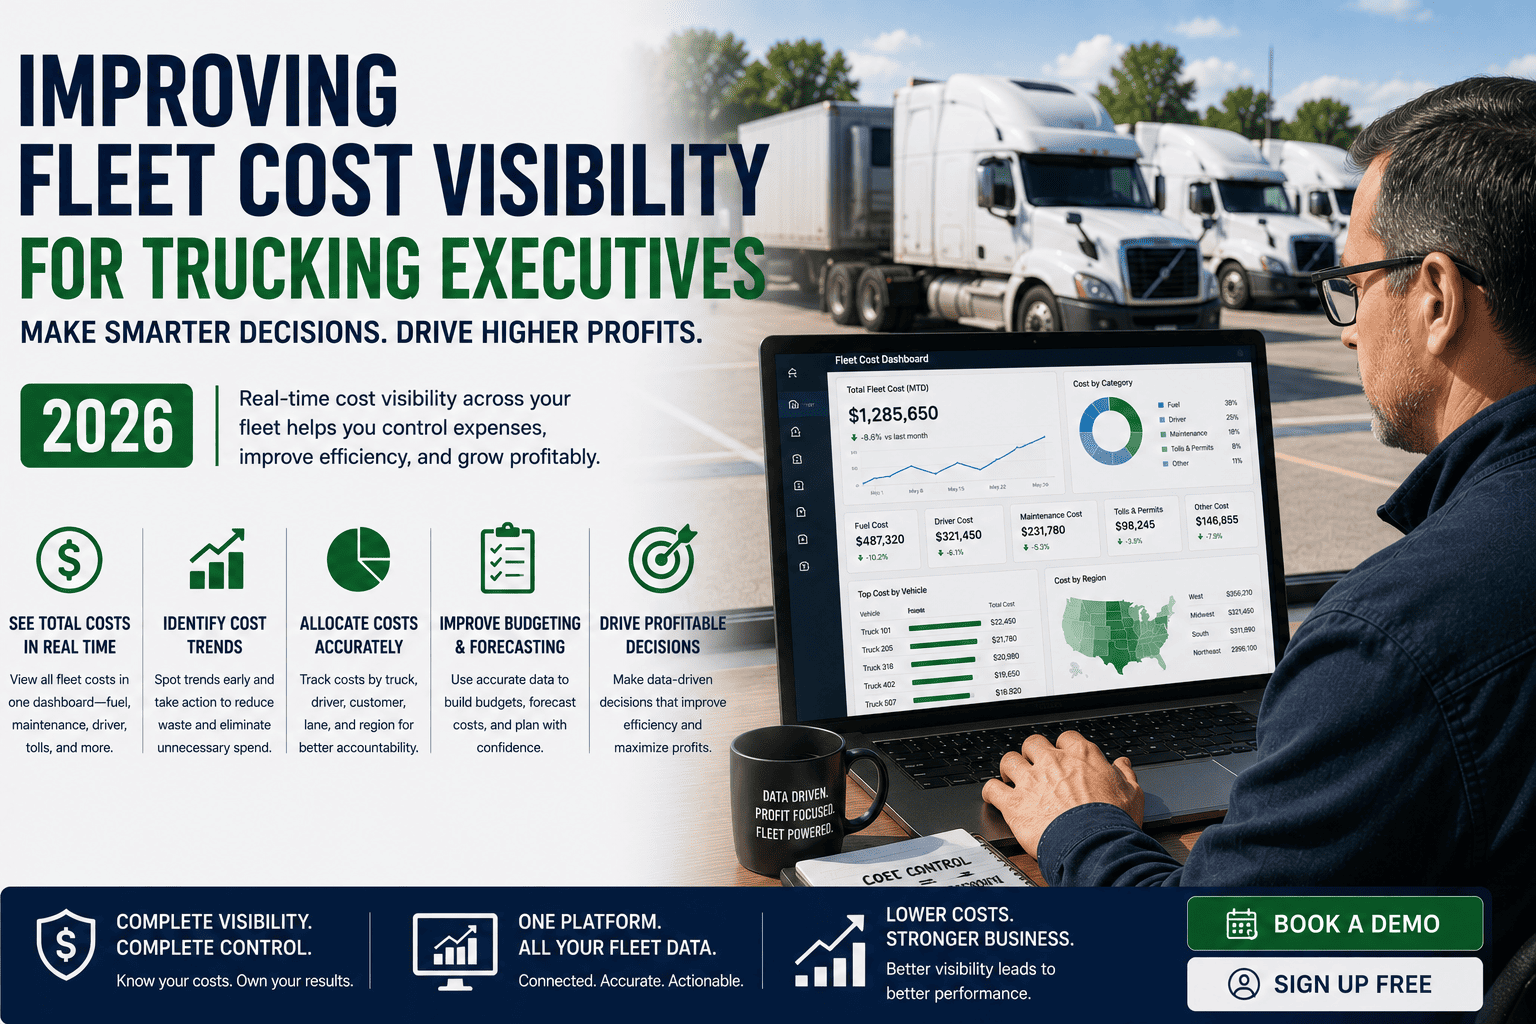
Ask a trucking executive what their fleet costs to run and most can give you a number. Ask them which lane is actually profitable, which customer is quietly losing money every month, or why cost per mile crept up last quarter, and the confident answer usually turns into "let me check with operations and get back to you." That gap between having data and having answers is the real problem. Spreadsheets, maintenance logs, fuel cards, and dispatch notes all hold pieces of the picture, but by the time someone stitches them together into a report, the decision that report was supposed to inform has already been made without it.
Industry-wide, the average cost to run a truck now sits above 2.30 dollars per mile, while top-performing fleets hold that number below 1.70 through tighter tracking and faster decisions. Best practice for 2026 is built around four executive-level numbers shown in real time: cost per mile, vehicle utilization, unplanned downtime, and preventive maintenance compliance. Fleets that move from spreadsheet reporting to a live dashboard typically see measurable cost per mile improvement within six months, simply because problems get caught while they're still small.
Why Executives Fly Blind Without Real-Time Cost Visibility
Most fleets are not short on data. They are short on data that has been pulled together, refreshed, and put in front of the right person before a decision needs to be made. Fuel card transactions sit in one system, maintenance work orders sit in another, and mileage and route data live in the telematics platform. None of it is designed to answer the question an executive actually asks in a Monday morning meeting: is this business more or less profitable than it was last quarter, and why.
The Spreadsheet Lag Problem
By the time someone exports data from three systems, cleans it up, and builds a report, the numbers are already a week or two old. A cost spike that started three weeks ago doesn't show up on anyone's radar until the monthly close, which means the fleet has already absorbed weeks of unnecessary cost before a single corrective action gets taken.
Siloed Data Hides the Full Story
A maintenance manager sees repair costs. A dispatcher sees route performance. A finance lead sees the invoice total. No single person sees how a specific lane's low rate, a specific truck's rising repair bill, and a specific customer's slow-pay terms combine to quietly erase margin on an account everyone assumed was healthy.
Reactive Decisions Cost More Than Proactive Ones
Without live visibility, executives end up managing by exception, reacting to the breakdown, the missed delivery, or the customer complaint after it has already happened, instead of catching the trend line that predicted it weeks earlier.
FleetRabbit pulls cost per mile, utilization, downtime, and maintenance compliance into a single dashboard that updates automatically from the data your fleet already generates. You can sign up here to see your real numbers in minutes, or book a demo if you'd rather walk through it with our team first.
The Four Numbers Every Executive Dashboard Should Lead With
Fleet reporting fails when it shows thirty metrics at once and forces the reader to figure out which ones matter. Best practice for 2026 keeps four numbers front and center, with everything else available one click deeper.
| Core Metric | Industry Average | Top-Quartile Target | Why It Belongs On Page One |
|---|---|---|---|
| Cost Per Mile | Roughly $2.30+ | Below $1.70 | Rolls fuel, maintenance, insurance, and depreciation into one number leadership can track over time |
| Vehicle Utilization | Varies by segment | 92%+ for delivery fleets | Reveals underused assets quietly costing money without ever breaking down |
| Unplanned Downtime | Above 6.5% of scheduled days | Below 6.5% | Directly tied to lost revenue, emergency repair premiums, and customer service risk |
| PM Compliance Rate | Around 70% | 95% or higher | The strongest single predictor of whether breakdowns are rising or falling |
From Cost Center To Profit Lens: Lane And Customer Profitability
Once the four core numbers are visible, the next layer of value comes from breaking cost per mile down by lane and by customer instead of looking at the fleet as one blended average. A fleet-wide cost per mile of 2 dollars can hide a lane running at 1.60 and another quietly running at 2.80, and without that breakdown, the losing lane keeps getting the same rate every renewal cycle.
Lane Profitability
Mapping cost per mile against the actual rate paid on each lane shows which routes are subsidizing which. A lane with chronic detention, long empty miles, or high toll exposure can look fine on a revenue report and still be losing money once the full cost picture is applied.
Customer Profitability
The same logic applies to customer accounts. A high-volume customer with strict appointment windows, frequent detention, or slow-pay terms can cost more to serve than a smaller account with flexible scheduling, even if the invoice total looks larger. Seeing that clearly changes how contracts get renegotiated.
Turning Insight Into Action
Once a lane or account is flagged as underperforming, the fix is usually a rate conversation, a scheduling change, or a decision to walk away, not a mystery. The visibility is what makes that conversation possible in the first place.
Building An Executive Dashboard People Actually Use
A dashboard only creates value if people open it. Getting there takes a deliberate rollout, not just a login for every manager.
Start With A Clean Baseline
Pull the last 90 days of cost, mileage, and maintenance data into one connected view so everyone is looking at the same starting point before anyone tries to act on it.
Assign One Owner Per Metric
Cost per mile without an owner becomes a number nobody feels responsible for. Assigning a specific leader to each of the four core metrics turns a dashboard from a report into an accountability tool.
Review On A Fixed Cadence
A weekly fifteen-minute review of the four core numbers, with drill-down only when something moves outside its normal range, keeps the habit sustainable instead of becoming another meeting nobody wants to attend.
FleetRabbit connects your fuel, maintenance, and mileage data automatically and breaks cost per mile down by lane and by customer, not just by fleet average. Start free and connect your first vehicles today, or book a walkthrough to see your own accounts analyzed.
Benchmarks Worth Reporting To The Board
Frequently Asked Questions
The Bottom Line On Fleet Cost Visibility
Executives don't need more data. They need the four or five numbers that actually explain profitability, refreshed in real time, and broken down by lane and customer instead of buried in a fleet-wide average. The fleets pulling ahead in 2026 aren't the ones drowning in reports, they're the ones who cut their dashboard down to what matters and built a habit of actually looking at it every week.
Stop waiting for the monthly close to find out cost per mile crept up or a lane quietly stopped being profitable. FleetRabbit turns scattered fuel, maintenance, and mileage data into one live, board-ready view of fleet economics. Sign up free and connect your first vehicles today, or book a short demo to see your own cost per mile, lane, and customer data walked through live.







