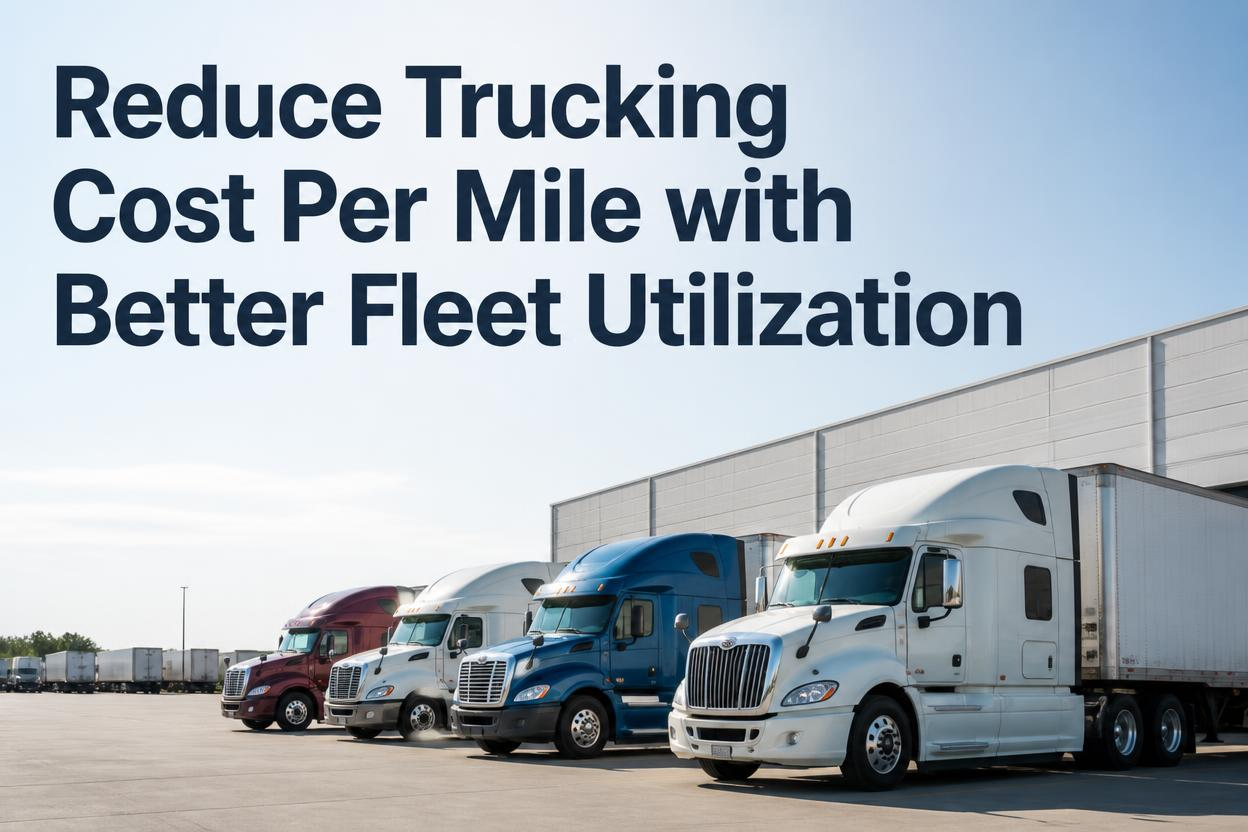
Ask a fleet manager for their cost per mile and most can answer instantly. Ask them what it looks like truck by truck, and the room goes quiet. That gap between the fleet-wide number and the real per-truck picture is exactly where profit disappears, one idling engine, one underused trailer, and one inefficient route at a time, without ever showing up as a single obvious mistake.
Average trucking operating cost reached 2.26 dollars per mile in recent industry benchmarks, with fuel and driver pay alone making up roughly 70 percent of that figure. Idle time above 15 percent of engine-on hours and asset utilization below 60 percent are the two most common hidden leaks. Fleets that track utilization per truck and act on it typically cut cost per mile by 8 to 15 percent within months.
What's Actually Inside Your Cost Per Mile
Cost per mile only becomes useful once it's broken into its real parts instead of one blended number. Total operating cost divided by miles driven is simple math, but most fleets build the number wrong by using total miles instead of revenue-generating miles, which hides exactly how much deadhead running and downtime are really costing.
| Cost Category | Typical Cost Per Mile | Share of Total CPM | Where Utilization Helps |
|---|---|---|---|
| Driver Compensation | 0.65 to 0.80 dollars | 30 to 35 percent | Fewer deadhead and idle hours mean more paid miles per driver day |
| Fuel | 0.45 to 0.55 dollars | 25 to 30 percent | Idle reduction and route optimization directly cut fuel burn |
| Truck and Trailer Payments | 0.35 to 0.40 dollars | 15 to 18 percent | Higher asset utilization spreads fixed payments over more revenue miles |
| Maintenance and Repairs | 0.18 to 0.25 dollars | 8 to 11 percent | Predictive scheduling avoids downtime that inflates cost per mile |
| Insurance and Permits | 0.10 to 0.15 dollars | 5 to 7 percent | Better safety data and utilization records can support lower premiums |
| Tolls, Tires, and Other Variable Costs | 0.08 to 0.12 dollars | 4 to 6 percent | Optimized routing reduces unnecessary toll roads and tire wear |
FleetRabbit pulls GPS mileage, fuel data, and maintenance costs into one live cost-per-mile view for every truck in your fleet. Sign up free and see where your margin is actually leaking.
The Utilization Leaks Quietly Killing Your Margin
Trucks that look fine on a monthly summary are often the ones costing the most. The problems rarely show up until costs are broken down per mile, per vehicle, and per route, which is exactly why these three leaks go unnoticed for so long.
Idle Time That Burns Fuel Without Moving a Load
Every hour an engine runs without the truck moving is fuel spent on zero revenue. Fleets that flag units idling above 15 percent of engine-on time catch this leak before it becomes a fuel budget crisis.
Deadhead Miles That Look Like Progress
Every empty repositioning mile carries real cost and zero revenue, and calculating cost per mile against total miles instead of revenue miles hides exactly how much this is quietly costing per load. A load that pays well on paper can still be a loss once deadhead miles are added to the true rate per mile.
Asset Underutilization Hiding in Plain Sight
A trailer sitting at 38 percent utilization looks like an asset on the balance sheet but behaves like a cost on the P&L. Connecting GPS and telematics data to flag units running below 60 percent utilization surfaces this problem while there's still time to act, whether that means rerouting, reassigning, or retiring the asset.
The Utilization Formula Behind a Lower Cost Per Mile
Reducing cost per mile isn't about one big change, it's about consistently applying a simple formula: increase revenue miles per truck, decrease idle and deadhead miles per truck, and catch underperforming units before they drag down the fleet average. Every improvement in utilization directly spreads your fixed costs, truck payments, insurance, and permits, over more productive miles, which lowers cost per mile even if variable costs stay flat.
Step One: Track Cost Per Mile Truck By Truck
Pull truck payments, insurance, fuel, maintenance, tolls, and driver pay into separate buckets for every individual unit instead of a fleet-wide blend that hides outliers. A truck costing 40 to 80 percent more per mile than the fleet average won't show up in an annual review, but it will show up the moment you look at monthly, per-truck data.
Step Two: Optimize Routes Around Revenue Miles
Route optimization tools reduce both deadhead miles and unnecessary toll roads, directly lowering the denominator problem that inflates cost per mile. Planning the next load before delivery, rather than dropping a trailer and searching afterward, keeps trucks moving on paid miles more consistently.
Step Three: Act on Idle and Utilization Alerts Monthly
Doing this analysis by hand across a fleet of 20, 50, or 200 trucks is exactly the kind of work that should be automatic. Monthly comparison catches idle time and utilization problems while there's still time to repair, reroute, or retire the truck responsible.
FleetRabbit flags idling units above 15 percent and underutilized assets below 60 percent automatically, so leaks get caught within weeks instead of at year-end. Book your demo to see it applied to your fleet's real numbers.
Before and After: What Utilization Improvement Actually Looks Like
The difference between a fleet guessing at efficiency and one actively managing utilization shows up clearly once the numbers are compared side by side.
| Metric | Before Utilization Tracking | After Utilization Tracking | Typical Improvement |
|---|---|---|---|
| Average Idle Time | 18 to 25 percent of engine hours | 10 to 12 percent of engine hours | 30 to 40 percent reduction |
| Asset Utilization | 50 to 60 percent | 70 to 80 percent | 15 to 25 percentage point gain |
| Deadhead Miles Per Load | 15 to 20 percent of total miles | 8 to 12 percent of total miles | Roughly 40 percent reduction |
| Cost Per Mile | Fleet average or higher | 8 to 15 percent below prior average | Direct margin recovery |
The Return on Fixing Utilization First
Utilization improvements pay back faster than most cost-cutting initiatives because they don't require new equipment or renegotiated rates, only better visibility into data fleets already generate. Speeding, harsh braking, and idling habits alone can swing fuel and maintenance cost by 15 to 20 percent between two identical trucks running the same route, a controllable cost most fleets never isolate until they start tracking it per unit.
Compounding Savings Across a Fleet
For a 50-truck fleet averaging 2.20 dollars per mile, even a 10 percent cost per mile reduction across 100000 annual miles per truck translates into roughly 1.1 million dollars in recovered margin fleet-wide. Unplanned breakdowns average 2.4 days per event, and at 1200 to 2000 dollars in lost revenue capacity per day, catching maintenance issues early through better utilization data avoids a cost that never shows up until the truck is already stranded.
Getting Started Without Overhauling Your Operation
Start with the two metrics most fleets don't track but can improve fastest: idle time and utilization. A live, per-truck view of both usually surfaces within days of connecting existing GPS and fuel card data, not months of new process rollout. From there, route optimization and monthly per-truck cost reviews compound the gains without requiring a single new hire.
Key Takeaways on Reducing Cost Per Mile
Cost per mile rarely drops because of one dramatic decision. It drops because a fleet starts looking at the truck-by-truck data it was already generating and acts on what it finds, an idling engine here, an underused trailer there, a route with too much deadhead mileage. None of these leaks are complicated to fix once they're visible, and visibility is the part most fleets are missing.
With fuel and driver pay making up roughly 70 percent of every mile, and idle time or low utilization quietly inflating both, the fastest path to a lower cost per mile isn't a bigger negotiation or a new truck purchase, it's better data discipline applied consistently every month. Fleets that make this shift typically recover 8 to 15 percent of their cost per mile within months, not years.
Every idling truck and underutilized trailer is quietly inflating your cost per mile right now. FleetRabbit surfaces those leaks automatically from data you're already collecting, so you can fix them before they show up in next quarter's numbers. Start your free trial today with no credit card required.







