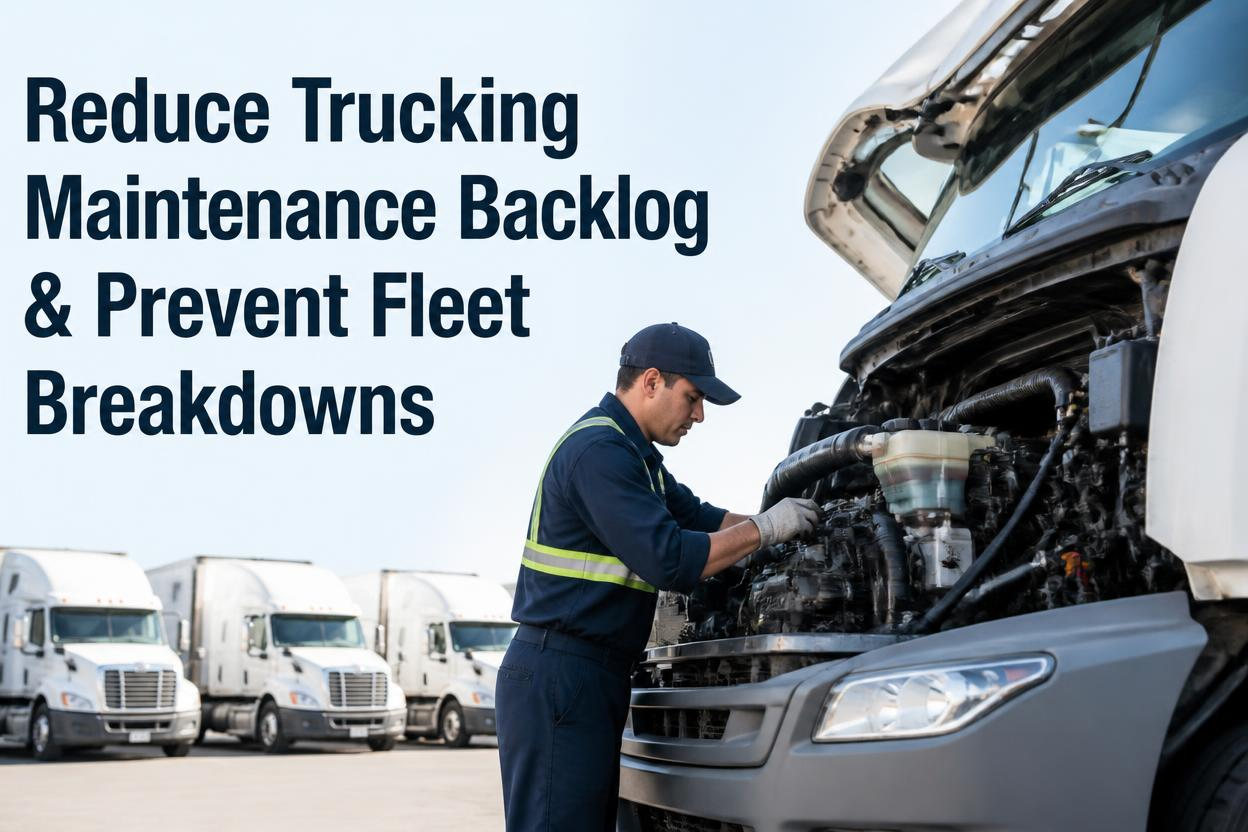
A fleet's maintenance backlog rarely announces itself. One oil change gets pushed back because a truck is needed for a route. A driver mentions the same rattle twice, and it slips through. A mechanic closes an urgent repair while a lower-priority inspection waits another week. None of it looks like a crisis, until the truck that kept "running fine" strands a driver on the interstate and the backlog that had been quietly stacking up for weeks finally announces itself the expensive way.
Fleets without organized work order processes typically run 25 to 40 percent higher maintenance costs than those with structured systems. Every unplanned breakdown costs 3500 to 6500 dollars, and unplanned downtime alone costs 448 to 760 dollars per truck daily. Fleets that shift to preventive maintenance and digital work order tracking cut maintenance spend by 15 to 20 percent and reduce unplanned downtime by 20 to 25 percent.
How a Maintenance Backlog Builds Without Anyone Noticing
A maintenance backlog is more than a stack of overdue work orders. It includes delayed preventive maintenance, skipped inspections, incomplete repairs, and driver-reported issues nobody circled back on. It sneaks up because a truck can complete routes after a delayed oil change, and a recurring brake noise doesn't stop a vehicle from passing daily use, until the small issue that kept getting pushed becomes the major repair that takes the truck out of service entirely.
Early Warning Signs Worth Watching
The clearest signs usually appear as patterns rather than single incidents: preventive maintenance intervals keep getting pushed back, the same defect gets reported by more than one driver, and a handful of vehicles start showing repeated tire replacements, brake repairs, or fluid leaks. A simple way to catch this early is to monitor PM compliance. If 90 percent of scheduled services are completed on time, the backlog is manageable. If that drops to 70 percent or lower for multiple weeks, it's a signal the team is losing the race against the schedule.
Why It's a Financial Problem, Not Just an Operational One
Backlog doesn't only create downtime, it increases emergency labor rates, parts costs, repeat repairs, driver frustration, and pressure toward early vehicle replacement. Vehicles over ten years old already average 1.10 dollars per mile in maintenance costs versus 0.20 dollars for vehicles under five years old, and a growing backlog accelerates that gap by letting small, cheap problems mature into expensive ones.
FleetRabbit tracks PM compliance, open work orders, and driver-reported defects in one dashboard, so nothing quietly slips through the cracks. Sign up free and see your fleet's real backlog today.
What's Actually Sitting in Your Backlog Right Now
Backlog isn't one type of problem, it's several kinds stacked on top of each other, each with its own risk level and its own fix.
| Backlog Type | What It Looks Like | Risk If Ignored | Fastest Fix |
|---|---|---|---|
| Overdue Preventive Maintenance | Oil changes, filter swaps, and inspections past their mileage or date interval | Accelerated engine wear and inspection failures | Automated PM scheduling with mileage and calendar triggers |
| Unresolved Driver Defects | Issues reported verbally or on paper that never became a work order | Small issues escalate into roadside breakdowns | Digital DVIRs that auto-generate work orders from defects |
| Parts-Delayed Repairs | A truck on the lift waiting on a part that wasn't checked before scheduling | Bay time wasted, vehicle sits half-repaired | Inventory checks tied directly into work order scheduling |
| Incomplete Repairs | A job marked "done" without full verification or road test | Repeat repairs and recurring complaints from the same vehicle | Granular work orders with clear completion criteria |
| Undocumented Service History | Repairs recorded in shop notebooks or memory instead of a system | No visibility into which vehicles are costing more than they earn | Centralized digital service history per vehicle |
The Work Order Delay Chain Feeding Your Backlog
Every backlog is really just a chain of small delays repeated across dozens of vehicles. Work order creation alone can take 30 to 60 minutes daily when a dispatcher manually compiles scattered maintenance requests. Add parts sourcing delays of one to three days, assignment gaps of one to four hours, repair time of one to five days, and documentation delays of another one to three days, and a single job can accumulate 4 to 16 days of total delay before it's genuinely closed.
Where Automation Cuts the Chain Fastest
Even a conservative 40 percent reduction from automation removes 2 to 6 days of delay per work order. For a fleet processing 50 work orders a week, that reduction compounds into a meaningfully smaller backlog within the first month alone, simply by removing the manual steps between a reported defect and a completed repair.
Keep Work Orders Small and Specific
Large work orders covering multiple tasks are hard to track and easy to leave half-finished. Breaking a complex job into smaller, focused work orders, and writing specific descriptions instead of vague notes, gives mechanics what they actually need and gives managers real visibility into partial progress instead of a single stalled ticket.
FleetRabbit auto-generates work orders from DVIR defects, routes them by severity, and tracks parts and labor in one place. Book your demo to see how much backlog disappears in the first month.
Prioritizing a Backlog You Can't Clear Overnight
No fleet clears a maintenance backlog in a single week, and trying to tackle everything at once usually means nothing gets finished properly. Sorting the backlog into three tiers makes the work manageable and protects the fleet from the highest-risk items first.
Tier One: Safety and Compliance Critical
Brake issues, steering defects, and anything that would fail a roadside inspection go first, regardless of cost or convenience. These are the items most likely to turn into a breakdown or an out-of-service order if delayed further.
Tier Two: High Repeat-Cost Vehicles
Vehicles showing a pattern of repeated repairs, high work order counts, or rising cost per mile should be reviewed as a group. Comparing repair spend, downtime, and inspection history across vehicles usually reveals a handful of problem units responsible for a disproportionate share of the backlog.
Tier Three: Routine and Scheduled Items
Standard PM tasks that haven't yet caused a visible problem can be scheduled into upcoming slow periods once the first two tiers are under control, preventing them from becoming tomorrow's tier-one emergency.
What Clearing the Backlog Actually Looks Like
| Metric | Backlog-Heavy Fleet | Backlog-Managed Fleet | Typical Improvement |
|---|---|---|---|
| Planned vs Reactive Ratio | 55:45 | 80:20 | Every 10 percent shift lowers emergency repair costs |
| PM Compliance Rate | 70 percent or lower | 90 percent or higher | Fewer overdue services translating into breakdowns |
| Fleet Uptime | 85 percent | 95 percent | Roughly 36 additional revenue days per vehicle annually |
| Maintenance Spend Per Vehicle | Baseline reactive spend | 15 to 20 percent lower | Shift from emergency repair to planned maintenance |
The Return on Clearing Your Backlog Early
The financial case builds quickly once backlog reduction is underway. A 50 to 100 vehicle fleet moving from reactive to preventive maintenance typically reduces maintenance spend by 3 to 5 dollars per vehicle per day, generating 45000 to 150000 dollars in annual savings. Raising fleet uptime from 85 to 95 percent adds roughly 36 revenue days per vehicle each year, without buying a single additional truck.
Faster Than Most Fleets Expect
Trucking companies implementing fleet maintenance software typically see measurable financial returns within 3 to 6 months, driven by reduced emergency repair costs, faster maintenance response, lower administrative labor, and fewer compliance penalties tied to overdue documentation.
Getting Started on a Backlog That Feels Overwhelming
Start by digitizing service history and current PM schedules so the backlog becomes visible in one place instead of scattered across shop notebooks and memory. From there, prioritize the safety-critical tier first, then review the small group of high repeat-cost vehicles that are usually responsible for a disproportionate share of the problem, and let routine items fill in around your shop's slow periods.
Key Takeaways on Reducing Maintenance Backlog
A maintenance backlog rarely announces itself with a single dramatic failure. It builds through small, repeated delays: a pushed-back oil change, an unresolved driver complaint, a work order stuck waiting on a part nobody checked for in advance. By the time it's visible in a breakdown, the backlog has usually been growing for weeks, quietly inflating emergency labor costs and repeat repairs along the way.
With reactive repairs costing 3 to 9 times more than planned maintenance, and fleets without organized work order systems running 25 to 40 percent higher costs overall, the fastest path to a healthier fleet isn't a bigger repair budget, it's earlier visibility into the backlog that's already there. Fleets that make this shift typically recover 15 to 20 percent in maintenance spend and push uptime toward 95 percent within months, not years.
Every overdue PM, unresolved defect, and stalled work order is quietly building toward your next breakdown. FleetRabbit gives you one dashboard to see, prioritize, and clear your maintenance backlog before it costs you a truck. Start your free trial today with no credit card required.







