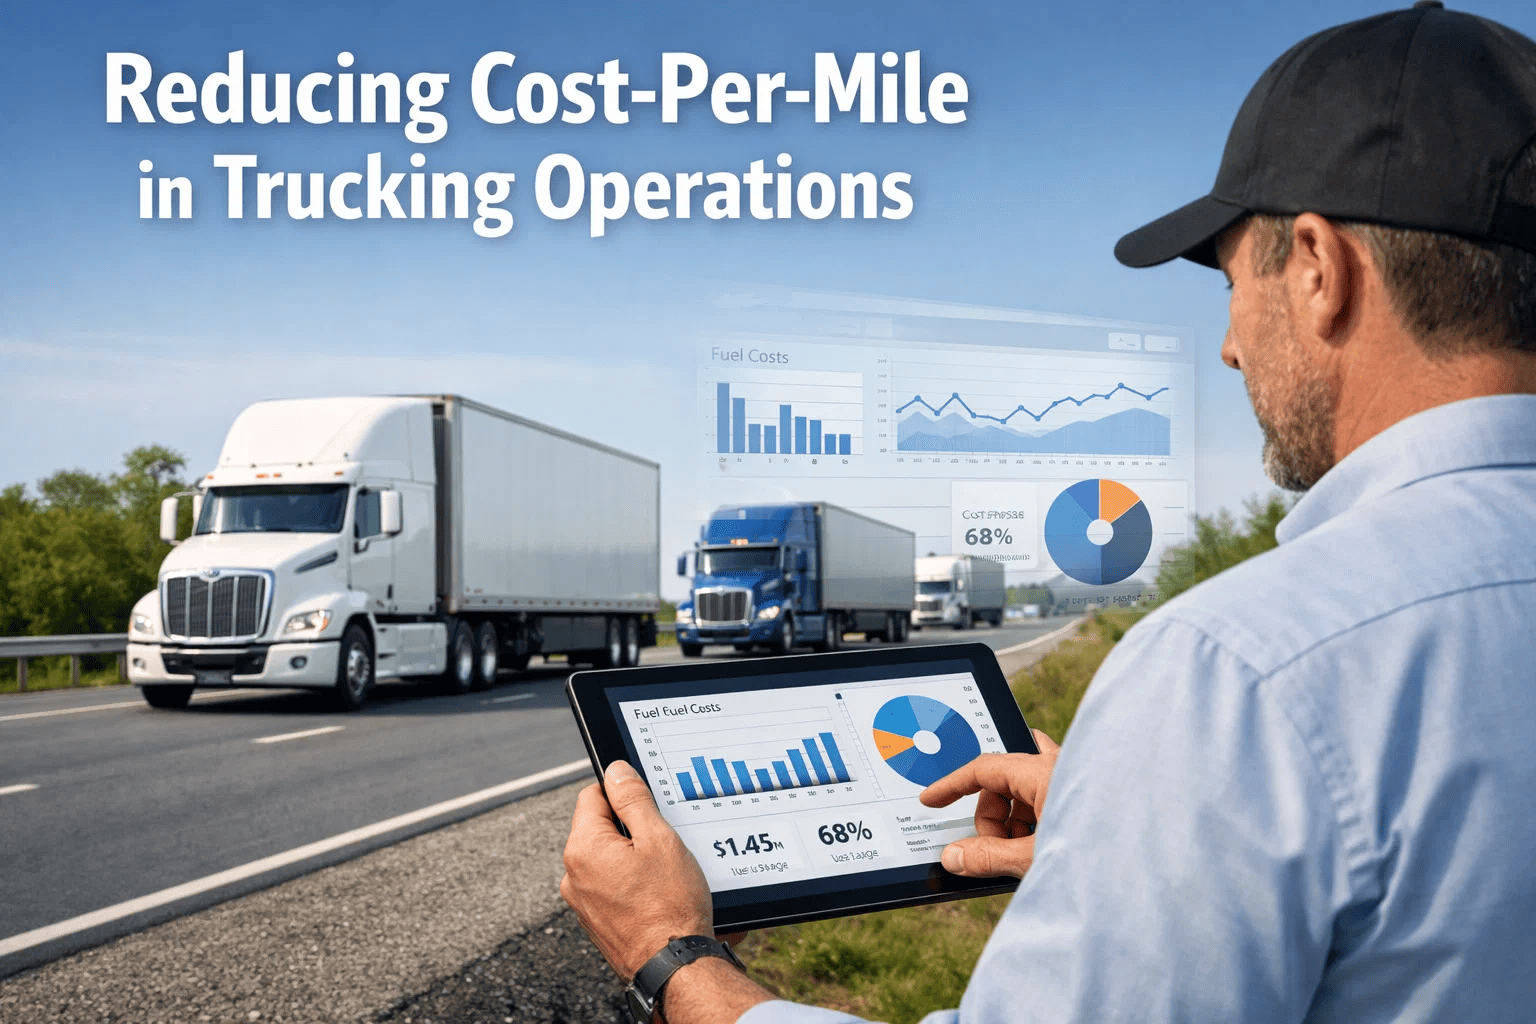
For trucking operators managing fleets of 10 to 500 vehicles, cost-per-mile is not merely an accounting metric. It is the single most important indicator of whether a fleet operation is generating value or eroding it. The cost-per-mile figure encapsulates every operational decision made across fuel purchasing, driver scheduling, maintenance planning, route selection, and asset utilization into one number that determines whether a carrier can bid competitively, retain customers, and sustain growth. Yet across the transportation and logistics industry, fleet managers consistently report that they cannot calculate an accurate real-time cost-per-mile for their operations. Data exists in disconnected systems. Fuel records live in spreadsheets. Maintenance costs sit in shop management software. Driver pay is tracked in payroll systems. Bringing these together manually takes days and produces a metric that is already weeks out of date by the time it reaches the desk of a VP of Operations or Chief Financial Officer. FleetRabbit was built to solve precisely this problem. Book a demo to see how FleetRabbit consolidates all cost inputs and calculates live cost-per-mile across your entire fleet portfolio.
This guide explains how fleet managers and operations executives can systematically reduce cost-per-mile in commercial trucking operations by deploying FleetRabbit's integrated fuel tracking, preventive maintenance scheduling, route analytics, and fleet utilization dashboards. You will learn the six cost drivers that most directly inflate cost-per-mile, how to measure and monitor each in real time, and how FleetRabbit customers consistently reduce total fleet operating cost by 18 to 27 percent within the first year of deployment.
Understanding Cost-Per-Mile: The Metric That Determines Fleet Profitability
Cost-per-mile in commercial trucking is calculated by dividing total operating costs for a defined period by the total miles driven during that period. The result is a rate that tells fleet operators exactly how much it costs to move a truck one mile. For a fleet generating $4.50 per mile in revenue, a cost-per-mile of $3.80 leaves $0.70 in margin per mile. A cost-per-mile of $4.20 leaves only $0.30. The difference between those two scenarios is often the difference between a profitable carrier and one facing cash flow pressure within 18 months.
The challenge is that cost-per-mile is a composite metric assembled from multiple cost categories that each have different measurement cycles, different data sources, and different drivers. Fuel is tracked at the pump or via fuel card. Labor is tracked in payroll. Maintenance is tracked in shop software or paper work orders. Depreciation is tracked in accounting systems. Insurance is a fixed periodic cost. Tolls and permits are tracked separately. Without a platform that pulls all of these inputs together into a single consolidated view, fleet managers are working from estimates rather than facts.
FleetRabbit's analytics and reporting engine connects fuel consumption data, maintenance cost records, work order history, and dispatch activity to generate a live cost-per-mile calculation that fleet managers can access from any device at any time. When a maintenance event occurs, cost-per-mile updates. When fuel prices shift, cost-per-mile reflects it. When route miles change due to dispatch decisions, cost-per-mile recalculates. For the first time, fleet managers and executives can manage cost-per-mile as a real-time operational variable rather than a lagging accounting output.
The Six Cost Drivers That Inflate Cost-Per-Mile in Trucking Operations
How FleetRabbit's Fuel Management Module Reduces Fuel Cost Per Mile
Fuel management in a commercial trucking operation is fundamentally a data problem. Fuel is purchased at hundreds of different locations by dozens of different drivers over thousands of route miles. Without systematic data capture and analysis, fleet managers cannot distinguish legitimate fuel purchases from misuse, cannot identify which vehicles are consuming fuel at above-baseline rates, and cannot quantify the cost impact of route decisions on fuel efficiency across the network.
FleetRabbit's fuel management module addresses this problem through three integrated capabilities. The first is fuel card integration, which pulls transaction-level data from fleet fuel card systems including quantity, location, vehicle, driver, and price per gallon into a consolidated view. The second is consumption tracking, which calculates miles-per-gallon by vehicle using odometer readings from inspection records and fuel transaction data, establishing a baseline for each asset and flagging deviations that indicate mechanical issues or driver behavior anomalies. The third is cost forecasting, which projects fuel expenditure for upcoming route plans based on distance, vehicle type, and historical consumption rates.
When FleetRabbit's fuel analytics identify a vehicle whose MPG has declined by more than 12 percent from baseline over a 30-day period, the system generates an alert that links the fuel performance decline to the vehicle's maintenance record. In many cases, the decline traces to a deferred PM item such as a clogged fuel injector, a tire pressure issue, or an air filter service overdue by several thousand miles. By connecting fuel performance to maintenance status, FleetRabbit allows fleet managers to treat declining MPG as a maintenance signal rather than an unexplained variance, resulting in interventions that restore fuel efficiency before the degradation accumulates further cost impact.
Preventive Maintenance as a Cost-Per-Mile Strategy
The financial relationship between preventive maintenance compliance and cost-per-mile is well established in fleet operations research. Fleets that maintain a planned maintenance ratio above 75 percent consistently show lower cost-per-mile than fleets operating below that threshold, driven primarily by three mechanisms. Emergency repair events that could have been prevented by timely PM compliance are eliminated. Equipment life is extended, reducing depreciation cost per mile over the asset's service life. And vehicle reliability improves, reducing the indirect costs of service failures including customer penalties, expedited freight costs, and driver rescheduling.
Despite this, a majority of commercial trucking fleets continue to manage maintenance primarily reactively. The primary reason is not lack of intent but lack of operationally effective tools. Paper PM schedules posted in shop offices are not visible to drivers or dispatchers. Spreadsheet tracking requires manual updates that fall behind during busy periods. Shop management software that is not connected to dispatch and fuel systems cannot automatically trigger PM intervals based on live mileage data.
FleetRabbit's preventive maintenance module resolves each of these gaps. PM schedules are configured in the system by asset type, with interval triggers set by mileage, engine hours, or calendar date depending on the maintenance task. When a vehicle accumulates mileage through dispatch operations tracked in the FleetRabbit system, PM interval warnings fire automatically on the defined schedule, visible to maintenance managers, dispatchers, and the assigned driver simultaneously. Work orders generated from PM alerts include the complete task checklist, parts requirements from the inventory module, and estimated labor hours, allowing the shop to plan the event efficiently.
For fleet executives, the result is a planning maintenance ratio metric that tracks across the entire fleet in the FleetRabbit analytics dashboard, updated daily as work orders are closed. When planned maintenance ratio trends below target levels, the dashboard identifies which asset categories or locations are falling behind and which specific vehicles most urgently require attention. This replaces the guesswork of manual tracking with a structured, data-driven maintenance management process that directly and measurably reduces cost-per-mile over time.
Fleet Utilization Analytics: Right-Sizing the Asset Base to Reduce Fixed Cost Per Mile
One of the least visible contributors to high cost-per-mile is fleet over-sizing. Carriers that have grown by acquisition, added assets during high-demand periods, or retained older vehicles beyond their optimal economic life frequently carry asset inventory that is generating fixed cost without commensurate revenue. Identifying these assets requires utilization data by vehicle, including revenue miles per period, productive hours, and load factor where applicable. Without this data, fleet managers cannot distinguish assets that are underutilized due to temporary market softness from assets that are chronically underperforming and should be disposed of or redeployed within the network.
FleetRabbit's analytics and reporting module delivers fleet utilization analysis at the individual vehicle level, aggregated by vehicle class, by terminal location, and by operating region. Fleet managers can sort their asset base by utilization percentile, identify the bottom quartile of performers, and export the analysis in a format suitable for executive review or board-level discussion of fleet right-sizing decisions.
For multi-location fleet operators, the utilization analysis also reveals imbalances that can be corrected by redeployment. When one terminal is running assets at 88 percent utilization and another is running a surplus of vehicles at 54 percent utilization, the opportunity to transfer assets rather than add to the higher-utilization location is immediately visible in the FleetRabbit dashboard. This redeployment capability reduces the cost of new asset acquisition while improving cost-per-mile at both locations simultaneously.
Dispatch Optimization and the Reduction of Deadhead Miles
Deadhead miles are one of the most controllable contributors to high cost-per-mile in truckload and LTL operations, yet they are frequently managed by dispatchers working from incomplete information and making decisions under time pressure without visibility into the full network picture. A dispatcher who cannot see the real-time location of all available assets, the status of all pending loads, and the fuel cost implications of different driver-to-load assignments cannot optimize for minimum deadhead. They assign based on proximity estimates and availability assumptions that are frequently inaccurate.
FleetRabbit's dispatch module provides dispatchers with a consolidated view of fleet location, driver hours of service status, and outstanding load requirements, allowing load assignment decisions to be made on the basis of complete, current information. When a new load requirement is entered, the system surfaces the nearest available drivers with compliant HOS status, estimated drive time to pickup, and projected empty miles for each option. The dispatcher selects from a ranked list of options rather than working from memory or fragmented data sources.
Over a 12-month deployment period, FleetRabbit customers operating truckload fleets typically report deadhead mile reductions of 8 to 14 percent compared to their pre-deployment baseline. In a fleet averaging 200,000 miles per year per truck and 20 percent deadhead, a 10 percent reduction in deadhead equals 4,000 revenue-generating miles recovered per truck per year. At $0.45 per mile fuel cost and $0.30 per mile driver cost, that represents a cost avoidance of $3,000 per truck per year from dispatch optimization alone, before accounting for revenue recovered on the additional loaded miles.
How FleetRabbit Connects All Cost Inputs Into a Single Cost-Per-Mile Dashboard
The core value proposition of FleetRabbit for cost-per-mile management is integration. Individual cost reduction initiatives in fuel, maintenance, or utilization produce partial results when the data from each initiative lives in a separate system. The compound effect of all cost reduction initiatives cannot be measured, and fleet executives cannot determine which initiatives are producing the most cost improvement per dollar of management attention invested.
FleetRabbit's analytics and reporting module aggregates data from every operational module in the platform and from connected integrations including telematics systems, fuel card programs, and accounting software into a unified cost-per-mile calculation refreshed in near real time. The dashboard breaks cost-per-mile down by category, showing fuel cost per mile, maintenance cost per mile, driver cost per mile, and overhead allocation per mile as separate tracked values. Executives can see not only the total cost-per-mile trend but which cost category is driving improvement or deterioration at any point in time.
This visibility transforms cost-per-mile from a lagging accounting metric reviewed quarterly into a leading operational indicator reviewed daily. When maintenance costs per mile trend upward, the dashboard immediately surfaces the specific assets or repair categories responsible. When fuel costs per mile increase, the analytics module shows whether the driver is telematics, fuel price, route, or consumption anomaly. Fleet managers and VPs of Operations who use FleetRabbit's cost-per-mile dashboard consistently report that the speed of insight allows them to correct cost deviations before they accumulate into significant quarterly variances rather than discovering the problem after the quarter has closed.
See Your Fleet Cost-Per-Mile in Real Time
FleetRabbit consolidates fuel, maintenance, dispatch, and utilization data into a live cost-per-mile dashboard that fleet managers and executives can access from any device. No manual data assembly. No waiting for period-end reports. Book a demo to see the cost-per-mile dashboard built for your fleet size and operational profile.
Building a Cost-Per-Mile Reduction Program: A Structured Approach for Fleet Managers
Reducing cost-per-mile is not accomplished through a single initiative. It requires a structured program that addresses each major cost driver systematically, measures the impact of each intervention, and sustains improvement through consistent operational discipline reinforced by data visibility. The following framework describes the approach FleetRabbit customers use to build a cost-per-mile reduction program using the platform's integrated capabilities.
Key Performance Benchmarks: Cost-Per-Mile by Fleet Segment
Understanding where your fleet's cost-per-mile stands relative to industry benchmarks is essential context for setting improvement targets. The benchmarks below represent operating cost ranges from the American Transportation Research Institute and are provided as general reference points. Your fleet's specific cost structure will vary based on lane characteristics, equipment age, geographic operating environment, and contract terms with customers and fuel suppliers.
| Fleet Segment | Industry Cost-Per-Mile Range | Top Quartile Performance | FleetRabbit Impact Area |
|---|---|---|---|
| Long-Haul Truckload | $1.72 to $2.10 per mile | $1.72 to $1.85 | Fuel efficiency, driver coaching, PM compliance |
| Regional Truckload | $2.05 to $2.55 per mile | $2.05 to $2.20 | Dispatch optimization, deadhead reduction, utilization |
| LTL Operations | $2.40 to $3.20 per mile | $2.40 to $2.70 | Load planning, route efficiency, PM scheduling |
| Last-Mile Delivery | $2.80 to $4.50 per mile | $2.80 to $3.10 | Vehicle utilization, maintenance compliance, fuel tracking |
| Flatbed and Specialized | $1.90 to $2.50 per mile | $1.90 to $2.10 | Equipment inspection compliance, parts management |
FleetRabbit for Fleet Executives: Cost-Per-Mile as a Strategic Management Tool
For VPs of Operations, CFOs, and fleet directors overseeing multi-terminal or multi-state operations, cost-per-mile is not just an operational metric. It is the basis for bid pricing, contract renewal negotiations, capital expenditure justification, driver compensation benchmarking, and fleet technology investment decisions. Having accurate, timely, and comparable cost-per-mile data across all operational segments is a competitive capability that directly affects the quality of every strategic decision a fleet executive makes.
FleetRabbit's executive analytics layer provides cost-per-mile analysis at the portfolio level, broken down by terminal, by route type, by vehicle class, and by time period, allowing executives to identify where cost performance is strongest and where it requires intervention. The rolling trend view shows cost-per-mile movement over 3, 6, and 12-month windows, making it possible to detect structural changes in cost structure rather than reacting only to period-to-period noise.
For fleets operating in a contract pricing environment, the FleetRabbit cost-per-mile dashboard serves as the objective foundation for tariff review conversations with customers. When a carrier can demonstrate that fuel cost inputs have increased the cost-per-mile by $0.12 over the prior 12 months using documented, system-generated data, the case for rate adjustment is substantively stronger than an estimate assembled from memory or from an accounting report assembled days before the negotiation.
Frequently Asked Questions
Reduce Cost-Per-Mile With Real-Time Fleet Intelligence From FleetRabbit
FleetRabbit gives fleet managers and executives the fuel analytics, preventive maintenance automation, dispatch visibility, and utilization intelligence needed to identify and reduce every driver of high cost-per-mile across the entire fleet portfolio. No manual data assembly. No delayed reporting. No missed savings from undetected cost drivers.







