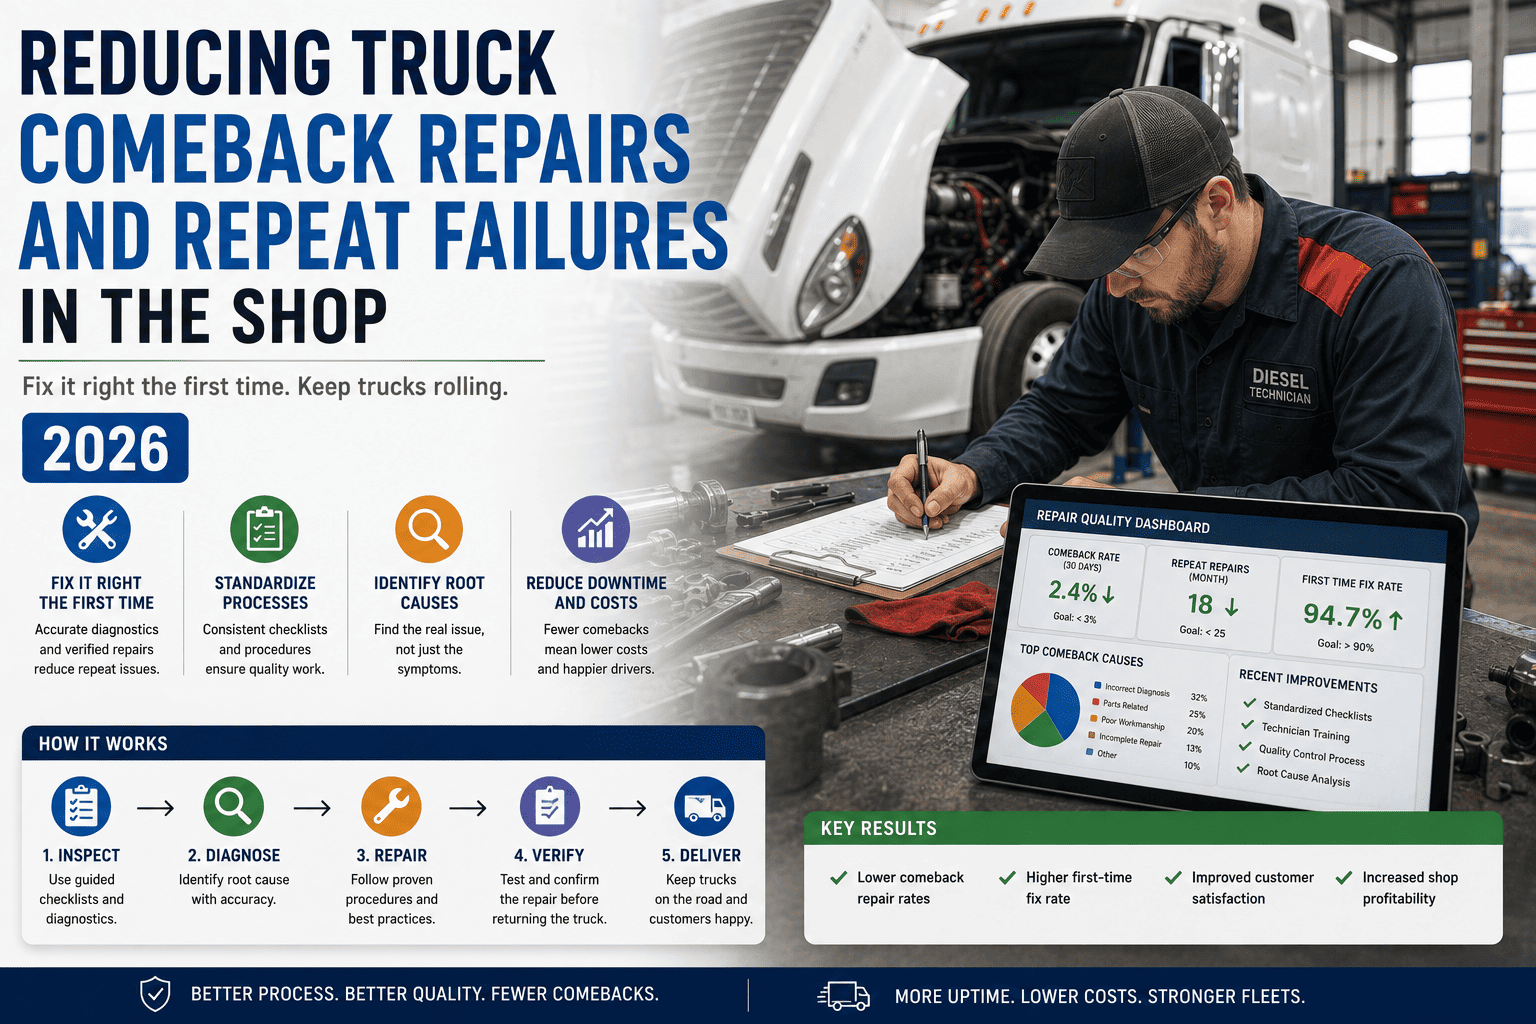
Few things drain a shop's productivity faster than a truck that comes back for the exact same problem it was already repaired for. The technician's time gets spent twice, the vehicle racks up extra downtime, and the driver loses trust in the maintenance program. Comeback repairs are rarely random. They almost always trace back to a handful of preventable causes, and fleets that start measuring them systematically are usually surprised by how much hidden cost a high repeat-repair rate has been quietly creating.
A healthy fleet keeps its comeback rate under 3 percent of total work orders, with some benchmarks targeting below 1 percent. First-time fix rate, the share of repairs completed correctly on the first visit, should sit at 80 percent or higher, with 90 percent considered the industry standard. Falling below 85 percent on first-time fix rate is a clear signal of systemic diagnostic or process problems rather than isolated technician error.
What Actually Counts As A Comeback Repair
A comeback, sometimes called a repeat repair or rework, is when a vehicle returns for the same underlying issue within a defined window after a repair was supposedly completed. Defining that window matters more than fleets often realize. Some operations treat anything within 30 days as a comeback, while others extend the window to six months, and that single definition choice can swing a fleet's reported comeback rate dramatically.
Accuracy also depends on whether the new visit is genuinely related to the original repair. A charging system replaced for a bad alternator that returns weeks later for an unrelated faulty relay is not a true comeback, even though both fall under the same repair code in many tracking systems. Fleets that track comebacks by specific component and root cause, rather than by broad repair category, get a far more honest picture of where repeat failures are actually concentrated.
Why First-Time Fix Rate And Comeback Rate Move Together
These two metrics are two sides of the same coin. First-time fix rate measures how often a repair is done right on the first attempt, while comeback rate measures how often it later proves it wasn't. A fleet with a low first-time fix rate will almost always show a climbing comeback rate a few weeks later, since rushed or incomplete diagnostics show up first as longer repair times and then as vehicles returning for the same problem.
Measuring The Two KPIs That Drive This Down
Tracking comeback rate and first-time fix rate consistently is the foundation of any reduction effort. Both are simple to calculate, but only useful when measured the same way, every time, across the full fleet.
| Metric | Formula | Target Benchmark | Warning Sign |
|---|---|---|---|
| First-Time Fix Rate | Repairs fixed on first visit divided by total repairs | 80 percent or higher, with 90 percent as industry standard | Below 85 percent signals systemic diagnostic or process gaps |
| Comeback Rate | Repeat repairs for the same issue divided by total work orders | Under 3 percent, with leading fleets targeting under 1 percent | Repairs aren't addressing root causes, only symptoms |
Track By Component, Not Just By Fleet Average
A fleet-wide comeback rate of 2 percent can hide a serious problem if it's actually driven by one repair category running at 10 percent while everything else sits near zero. Breaking comeback and first-time fix rates down by component, by technician, and by vendor reveals exactly where rework is concentrated, turning a vague quality concern into a specific, fixable target.
FleetRabbit surfaces every vehicle's complete repair history and flags repeat issues automatically, so technicians diagnose root causes instead of symptoms. Sign up free to start tracking comeback rate by component, or book a demo to see root cause tracking in action.
A Practical Root Cause Process For Every Repair
Reducing comebacks comes down to building a consistent habit around every repair, not introducing a single new tool. The most effective fleets follow a short, repeatable checklist before any work order is closed out.
Pull Full Vehicle History First
Before diagnosing, review prior repairs on the same vehicle and component to check whether this is a true new failure or a continuation of an earlier issue that was never fully resolved.
Confirm The Root Cause, Not Just The Symptom
Verify what actually caused the failure rather than only replacing the failed part, especially when fault codes point to a system-level issue rather than a single component.
Inspect Adjacent Components
Check related parts that share load, vibration, or wear exposure with the failed component, since a part overlooked during the original repair is a common source of an apparent comeback.
Document With Structured Codes
Log the repair using standardized component and failure codes rather than free text, so the system can automatically detect a true repeat issue the next time the vehicle comes in.
What High-Performing Shops Do Differently
Shops with consistently low comeback rates share a few common habits. They give technicians full visibility into prior repair history before diagnosis begins, rather than relying on a driver's verbal description of the problem. They track first-time fix rate and comeback rate by individual technician and by repair category, identifying training needs early instead of waiting for a pattern to become obvious. They also resist the pressure to rush a vehicle back into service when diagnostic time is cut short, recognizing that a comeback repair almost always costs more total labor and downtime than getting the original repair right.
Vendor performance matters just as much as in-house technician quality. Fleets that outsource a significant share of repairs to third-party shops often have no visibility into which vendors have the highest comeback rates, simply absorbing the repeat cost without ever connecting it back to vendor quality. Tracking first-time fix rate by vendor identifies which shops consistently return vehicles fixed the first time and which ones quietly drive up total repair spend through rework.
Why The Cost Of A Comeback Is Higher Than It Looks
A comeback repair rarely shows up on a budget report as its own line item, which is exactly why it's so easy to underestimate. The real cost includes the original labor that didn't solve the problem, the second round of diagnostic time, the part that was likely replaced twice, and the additional downtime the vehicle accumulates while waiting for the second repair. Add in the lost technician hours that could have gone toward a different vehicle entirely, and a fleet with a comeback rate sitting well above the 3 percent benchmark is often losing far more productivity than its repair invoices alone would suggest.
Comeback repairs quietly eat into technician time, vehicle uptime, and driver trust. FleetRabbit gives your team full repair history at the point of diagnosis and tracks first-time fix rate automatically, so root causes get solved the first time. Sign up free to start tracking your fleet's repair quality, or book a demo to see how repeat failures get caught before they happen again.







