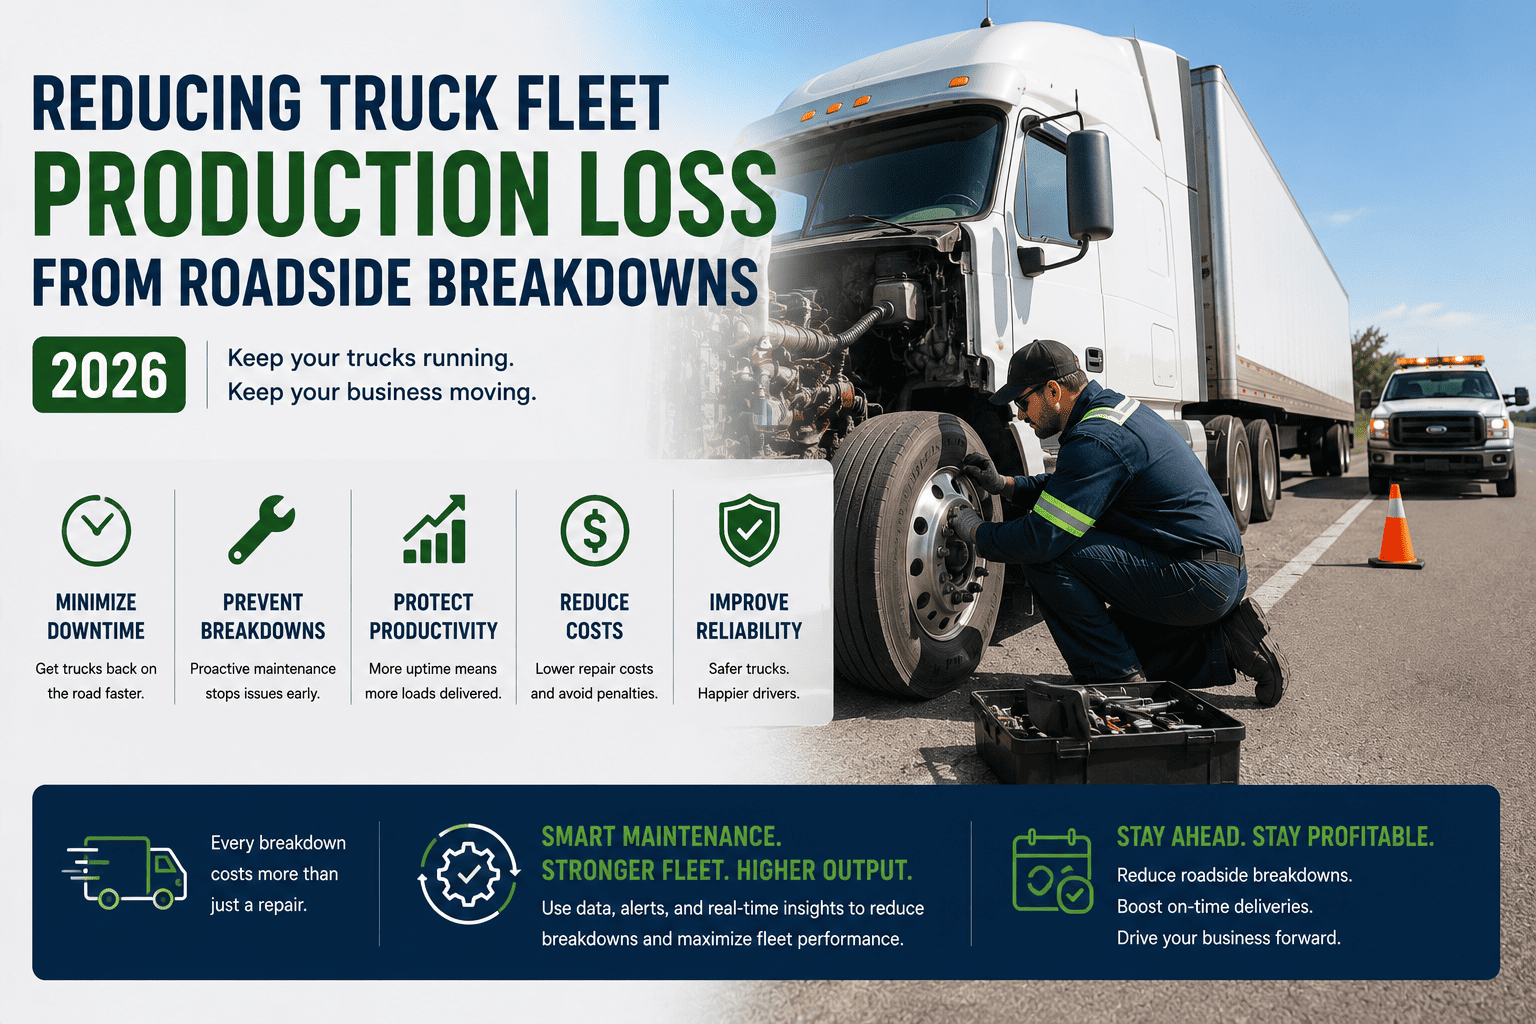
A single roadside breakdown does not just strand a truck. It strands a route, a delivery window, a customer promise, and a chunk of that week's revenue. In 2026, with per-mile operating costs sitting near 2.25 dollars and for-hire margins running razor thin, fleets can no longer treat breakdowns as bad luck. They are a measurable, preventable production loss, and the fleets that treat them that way are the ones protecting their bottom line.
Tires are responsible for roughly 53.5 percent of roadside breakdowns, and emergency roadside repair labor now runs 200 to 800 dollars per hour depending on the region and time of day. Heavy-duty towing after a breakdown commonly lands between 2,500 and 5,000 dollars or more. Fleets that shift to predictive, condition-based maintenance are cutting breakdown frequency by as much as 75 percent and trimming unplanned downtime significantly, turning roadside chaos into scheduled shop visits.
Why Production Loss Is the Real Number to Watch
Fleet managers often measure breakdowns by the repair invoice alone, but the invoice is only one line of a much bigger bill. Production loss is what happens around the breakdown: the load that sits undelivered, the driver hours burned waiting for a tow, the appointment that has to be rescheduled, and the customer who starts shopping around for a more reliable carrier. When a truck disappears from the schedule for a day, that capacity does not come back. It is simply gone.
The Hidden Layers Behind Every Incident
Underneath a single roadside event sit several layers of cost that rarely show up on the same report. Direct repair and towing charges are the most visible. Behind them sit lost freight revenue, detour mileage on backup vehicles, overtime for dispatch and drivers scrambling to cover the gap, and the quiet erosion of customer trust when deliveries slip. Add them together and a routine tire blowout can turn into a five-figure event by the time the ripple effects settle.
A Quick Way to See the Gap
Compare a scheduled repair to an emergency one for the same component. A brake job planned into a normal shop day uses standard labor rates and parts already on the shelf. The identical repair performed roadside after a failure pulls in emergency labor rates, expedited parts, a tow bill, and a missed delivery window. The part is the same. The bill is not even close.
FleetRabbit watches tire pressure, brake wear, voltage, and engine data around the clock, flagging problems while they are still cheap and easy to fix. You can sign up for FleetRabbit in minutes and start monitoring your fleet today, or book a demo to see the dashboard in action first.
What's Actually Breaking Down Out There
Not every component fails at the same rate, and knowing where to focus maintenance attention makes the biggest difference in reducing roadside events. The table below breaks down the most common failure points, why they happen, and how a production-loss mindset changes the response.
| Failure Point | Why It Happens | Typical Roadside Cost | Early Warning Signal |
|---|---|---|---|
| Tires | Underinflation, tread wear, heat build-up on long hauls | 300 to 1,500 dollars plus tow if a blowout occurs on highway | Gradual pressure drift and rising tread temperature |
| Brakes | Pad wear, fluid contamination, uneven application | 1,500 to 4,000 dollars for emergency roadside repair | Excessive brake application frequency and pad thickness trend |
| Electrical System | Battery degradation, alternator strain, wiring faults | Diagnostic fee plus 200 to 800 dollars hourly labor | Voltage anomalies and slow-starting patterns |
| Engine and Cooling | Coolant loss, sensor faults, deferred oil analysis findings | 5,000 dollars and up if it escalates to overhaul | Rising operating temperature and abnormal oil wear metals |
| Emissions and DPF | Missed regeneration cycles, poor fuel quality | 450 to 900 dollars for cleaning, more if the truck is derated | Backpressure trend and regeneration frequency |
Turning Reactive Maintenance Into a Predictive Habit
The fleets losing the least production time in 2026 are not the ones with the newest trucks. They are the ones that stopped waiting for a dashboard warning light and started acting on data days or weeks earlier. Predictive maintenance is not a single tool, it is a shift in how decisions get made across the whole operation.
Start With Visibility, Not a Full Overhaul
You do not need to replace every system overnight. Connect the telematics data you already have, set alert thresholds for the highest-cost failure points, and route those alerts to the person who actually schedules the shop bay. Most fleets see meaningful improvement within the first ninety days simply because problems that used to be invisible are now impossible to ignore.
Where Fleets Usually See the Fastest Wins
Tire and brake monitoring tend to deliver the quickest payback because the failure patterns are the most consistent and the roadside costs are the most painful. Electrical and battery health tracking follows closely behind, since a dead battery or alternator fault strands a truck just as fast as a blown tire but is even easier to catch early with continuous voltage monitoring.
Build the Habit Into Daily Operations
Predictive data is only useful if someone acts on it. Assign clear ownership for reviewing alerts, set a standard for how quickly a flagged issue moves into a scheduled repair slot, and track how many potential breakdowns get intercepted each month. That single number becomes one of the most convincing metrics you can bring to a leadership meeting.
A Simple 2026 Action Plan
Reducing production loss from roadside breakdowns does not require a massive budget on day one. It requires a sequence of decisions made in the right order.
Step One: Audit the Last Twelve Months
Pull every breakdown from the past year and tag each one by cause, cost, and how much delivery time was lost. This baseline is usually the moment fleet managers realize the true cost is higher than what shows up in the maintenance budget alone.
Step Two: Prioritize by Frequency and Cost
Rank failure points by how often they occur and how expensive they are when they hit the road. Tires and brakes almost always sit at the top of that list, which makes them the natural starting point for predictive monitoring.
Step Three: Put Alerts in Front of a Decision Maker
Data without a workflow just sits in a dashboard. Route every high-priority alert to the person who books shop time, and give them a standard turnaround target for moving that vehicle into a planned maintenance slot.
FleetRabbit turns raw telematics data into clear, prioritized maintenance alerts so your team fixes small problems before they become roadside emergencies. Ready to see it on your own fleet? Book a free demo and walk through your data with our team, or go ahead and sign up now to get started right away.
Frequently Asked Questions
Tires, brakes, batteries, and engines all send warning signs long before they fail on the highway. FleetRabbit reads those signs and puts them in front of your team while there is still time to act. Explore the platform with a free sign-up or walk through it live with our team on a quick call.







