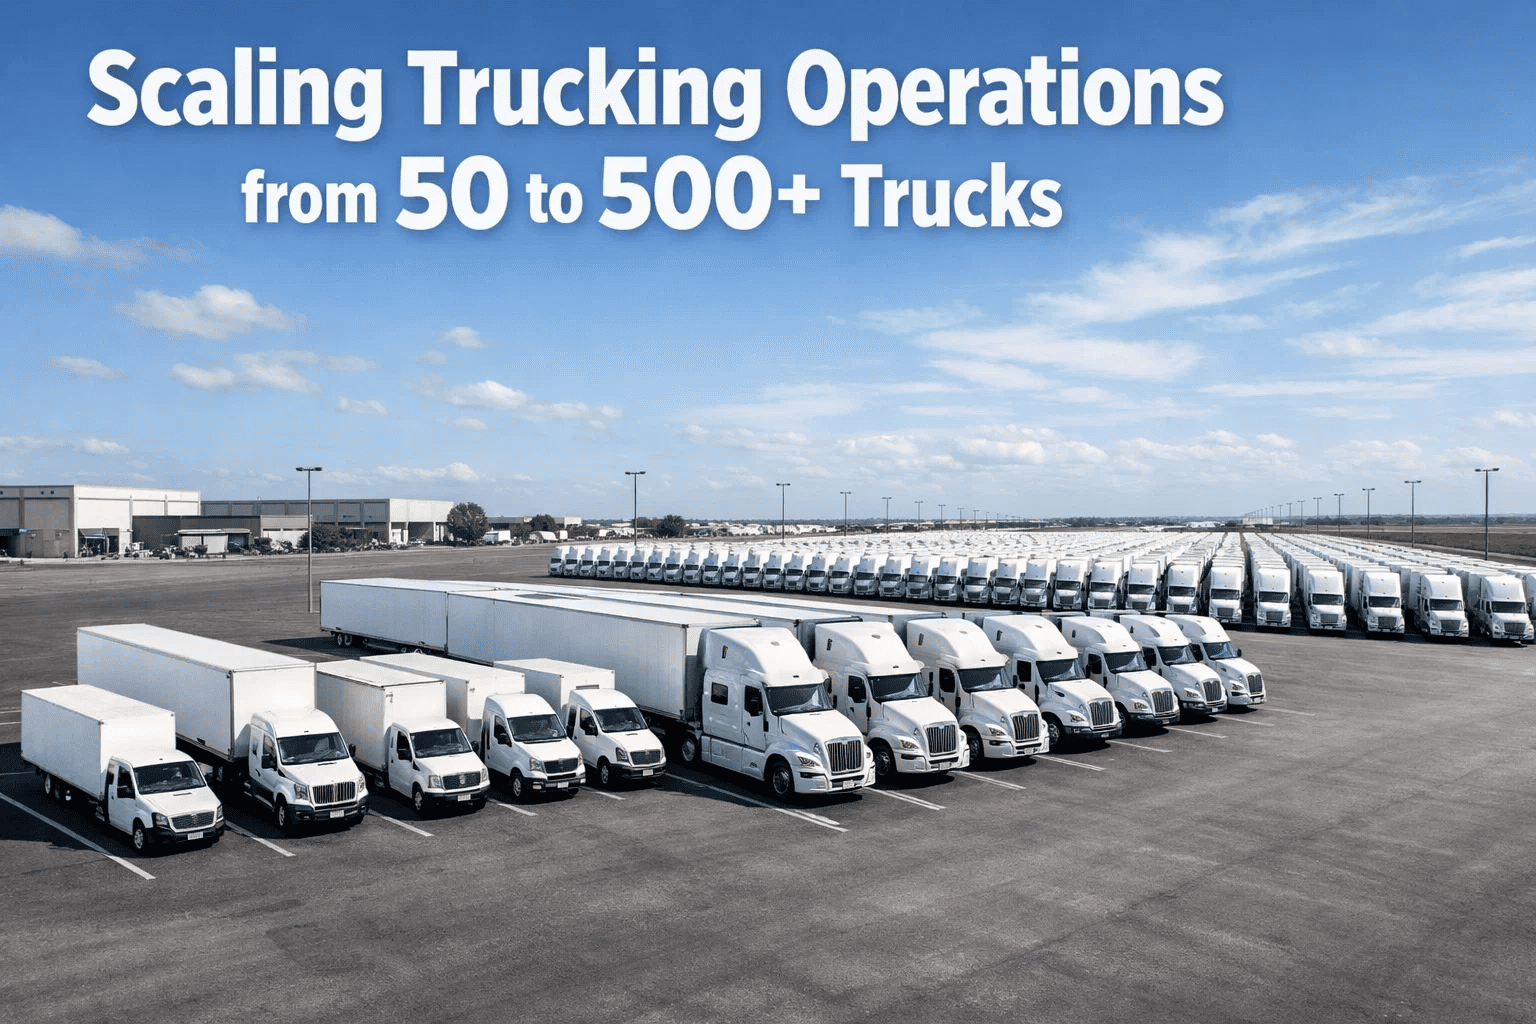
Growing a trucking company from 50 trucks to 500 trucks is not a linear scaling exercise — it is a series of organizational and operational transformation events, each triggered by the fleet size threshold at which the management practices, technology infrastructure, and operational processes that worked at the previous scale begin to break down under the demands of the next. The practices that allow a 50-truck owner-operator-heavy fleet to be managed effectively through personal relationships and informal systems become the bottlenecks that prevent a 200-truck carrier from achieving the driver utilization, compliance discipline, and cost management consistency required to compete for the larger freight contracts that justify the additional capacity. Fleet executives and ownership groups attempting to scale from 50 trucks to 500 trucks without understanding these transformation thresholds consistently find themselves reinvesting in operational rebuilds that could have been avoided with the right technology and organizational architecture in place before the scaling pressure arrived. Book a demo to discuss how FleetRabbit scales with your carrier as fleet size grows from 50 to 500 trucks and beyond.
Guide Summary
Scaling trucking operations from 50 to 500 trucks requires deliberate transitions in management structure, technology infrastructure, and operational discipline at each major fleet size threshold. This guide examines the four operational stages of carrier growth, the specific management and technology breakdowns that occur at each stage transition, the platform capabilities required to maintain compliance, cost control, and operational visibility as fleet size grows, and how FleetRabbit supports carriers through each growth stage without requiring disruptive technology platform changes between phases. The guide is directed at fleet owners, CEOs, COOs, and senior operations leaders responsible for carrier growth strategy.
Stage One: 50 to 100 Trucks — The Founder-Led Operations Transition
At 50 trucks, most carrier operations are running on the direct operational knowledge of the founder or a small founding team. The fleet manager or owner knows every driver by name, personally supervises the maintenance schedule, reviews fuel reports weekly, and handles compliance questions directly with dispatchers. This model produces high operational awareness at the top of the organization but creates a fundamental capacity constraint: the business cannot grow beyond the personal bandwidth of the individuals who are directly managing every detail of its operations.
Between 50 and 100 trucks, this constraint becomes acute. Adding trucks increases driver headcount, maintenance volume, compliance documentation, and dispatch coordination demands proportionally — but the personal management bandwidth of the founding team does not scale proportionally with the truck count. The first organizational adjustment most carriers make in this range is adding a dispatch supervisor or fleet manager to take over direct dispatch coordination. The challenge is that this person inherits the information management problem of the founder: all operational data is in the founder's head, spreadsheets on multiple computers, and paper records at the maintenance shop. The new manager has no systematic visibility, so the operational quality degrades from what the founder personally maintained before the delegation occurred.
The technology implication is clear: growth from 50 to 100 trucks requires a fleet management platform that transfers operational knowledge from people to systems — creating centralized visibility, structured documentation, and repeatable processes that allow new management layers to be effective without requiring the founder's personal presence in every operational decision. Book a demo to review how FleetRabbit creates the operational infrastructure that allows carriers to grow beyond the founder-led operations model.
Stage 1: 50-100 Trucks
Founder-Led Operations — The First Breakpoint
Critical Operational Challenges
Personal bandwidth of founders limits scalable dispatch coordination as driver count exceeds 50
Maintenance records in multiple disconnected formats cannot be transferred to new fleet managers without significant institutional knowledge loss
Compliance documentation — DVIR records, HOS logs, driver files — managed informally and not audit-ready as driver count crosses 75
Cost-per-mile tracking done manually in spreadsheets produces lagged, incomplete data that prevents effective rate and lane management decisions
Driver performance management relies on personal founder relationships rather than documented performance metrics
FleetRabbit Capabilities at This Stage
Centralized Asset Registry
Every vehicle's maintenance history, inspection records, and specification data in a single platform — transferable to new management without knowledge loss
Digital DVIR and PM Scheduling
Structured maintenance and inspection documentation that doesn't depend on founder-level oversight to maintain compliance quality
Basic Analytics Dashboard
Cost-per-mile, maintenance frequency, PM compliance rate, and driver performance metrics visible without manual spreadsheet compilation
Stage Two: 100 to 200 Trucks — The Management Layer Requirement
Between 100 and 200 trucks, the organizational challenge shifts from founder bandwidth to management architecture. The carrier now has enough operational complexity — 100 or more drivers, 3 to 8 terminals or drop yards, a maintenance team of 4 to 12 technicians, and a dispatch team of 5 to 15 personnel — to require a middle management layer with defined responsibilities and reporting accountability. The operational question is no longer "how does the founder handle this?" — it is "do we have the management roles, technology systems, and reporting infrastructure to coordinate operations across this scale without chaos?"
The most common failure mode at this growth stage is not the failure to hire the management layer — most carriers recognize the organizational need and add dispatchers, fleet managers, and maintenance supervisors at this scale. The failure is providing those managers with inadequate operational data infrastructure to manage their areas of responsibility effectively. A maintenance supervisor responsible for 150 vehicles across three locations who does not have consolidated visibility into which vehicles are due for PM services, which have open defect work orders, and what the current parts inventory level is at each location cannot manage preventive maintenance effectively — they can only react to failures as they occur. A fleet manager with 150 drivers who tracks HOS compliance through manual check-ins with dispatchers cannot maintain the systematic compliance discipline required for a carrier of that size operating under FMCSA scrutiny.
Stage 2: 100-200 Trucks
Management Architecture — The Middle Layer Challenge
Critical Operational Challenges
Maintenance supervisors managing 100 to 200 vehicles without consolidated work order and PM status visibility default to reactive maintenance programs, driving breakdown frequency upward
Compliance disciplines — DVIR completion, HOS monitoring, driver qualification files — require dedicated compliance management infrastructure rather than ad-hoc tracking
Terminal-level performance visibility requires regular manual reporting cycles — fleet executives cannot identify performance problems at specific locations without multi-day data collection delays
Fuel management at 100 to 200 trucks represents a budget line of $3.5 million to $8 million annually — requiring systematic monitoring, not periodic manual review of fuel card summaries
Driver recruitment and turnover management at this scale requires documented onboarding processes, performance tracking, and qualification file management that informal systems cannot support
FleetRabbit Capabilities at This Stage
Multi-Terminal Dashboard
Terminal-level and portfolio-level views of maintenance status, PM compliance, and vehicle availability visible to fleet manager and executives simultaneously
Automated Compliance Monitoring
HOS alerts, DVIR completion tracking, and driver credential expiration monitoring automated at scale — no manual tracking sheets required
Fuel Card Integration
Consolidated fuel consumption data from all vehicles and terminals — enabling fleet-level fuel cost monitoring and anomaly detection without manual data compilation
Stage Three: 200 to 350 Trucks — The Systems-Dependent Operations Threshold
At 200 to 350 trucks, carrier operations cross what industry practitioners describe as the "systems dependency threshold" — the fleet size at which the operational complexity exceeds the coordination capacity of management teams working with incomplete or fragmented data, regardless of management talent or personal work ethic. A fleet of 300 trucks generates, on a daily basis: 300 pre-trip DVIR inspections, 300 post-trip inspections, 300 driver HOS status updates, 65 to 90 active maintenance work orders (at typical work order intensity for a mature fleet), 1,200 to 1,800 individual fuel transactions, and hundreds of dispatch communications. No management team can process this volume of operational data manually and still make timely, high-quality decisions.
The carriers that scale through this threshold successfully are those that have invested in fleet management technology platforms — not the most sophisticated available, but the most systematically implemented available for their specific operational profile. The key word is implemented: many carriers at this stage have technology platforms that are nominally in use at some terminals but not others, configured for some workflows but not the most critical compliance and maintenance processes, and generating data that is not regularly reviewed in management accountability processes. A partially implemented fleet management system at 300 trucks delivers a fraction of its potential value — the operational complexity of the fleet size demands full implementation across all terminals and all operational workflows.
200 Trucks
Compliance Management Inflection
At 200 trucks, the FMCSA's compliance monitoring intensity increases — carriers with 200 or more drivers generate sufficient safety data for CSA intervention thresholds to be routinely triggered if compliance disciplines are not systematically managed. Compliance must transition from reactive tracking to proactive monitoring infrastructure.
FleetRabbit automated alert system becomes critical compliance infrastructure at this threshold — manual tracking cannot maintain the monitoring depth required.
250 Trucks
Maintenance Organization Transition
At 250 trucks, the maintenance department at a multi-terminal carrier typically has 15 to 25 technicians across locations. Coordinating parts inventory, work order prioritization, and PM scheduling without centralized maintenance management creates inefficiency and stockout risks that directly affect vehicle availability and downtime cost.
FleetRabbit parts and inventory module with cross-location visibility prevents redundant purchasing and emergency parts procurement at premium pricing — cost savings alone justify platform adoption at this scale.
300 Trucks
Analytics and Executive Reporting Requirement
At 300 trucks, the financial scale of individual cost categories — maintenance ($3M to $6M annually), fuel ($8M to $14M annually), insurance ($2M to $5M annually) — makes precision cost management at the asset level a material driver of carrier profitability. Executive reporting based on monthly financial summaries is insufficient for this level of operational decision-making.
FleetRabbit's analytics module provides cost-per-mile at vehicle level, terminal-level maintenance cost benchmarking, and fleet-level trend reporting in real time — enabling the data-driven decision making that 300-truck carrier financial management requires.
350 Trucks
Driver Performance Management Threshold
At 350 or more drivers, driver performance variability — in fuel efficiency, HOS compliance, DVIR completion, vehicle damage frequency, and safety incident rates — has a material impact on fleet cost and accident exposure. Identifying and managing the bottom performance quartile requires systematic data collection across all drivers, not periodic manual reviews of individual records.
FleetRabbit team management and analytics produces driver performance metrics — HOS compliance rate, DVIR completion, fuel consumption by driver — that enable performance-based coaching and accountability programs at scale.
Stage Four: 350 to 500 Trucks and Beyond — Enterprise Carrier Architecture
At 350 to 500 trucks, a carrier has crossed the threshold from regional operator to national carrier in operational complexity regardless of geographic footprint. The management infrastructure required to operate at this scale — multiple regional VPs or Directors, a dedicated compliance team, a structured maintenance organization with a Director of Maintenance, and a senior operations leadership team reporting collectively to a COO or CEO — mirrors the structure of enterprise carriers regardless of whether the carrier's revenue has yet reached enterprise carrier levels.
The technology requirements at this scale shift from operational management support to strategic decision support. Port-level analytics, lane profitability analysis, fleet composition optimization modeling, and capital expenditure planning based on vehicle life cycle data all require a fleet management platform that produces the underlying asset and operational data in structured, queryable form. Carriers that arrive at 400 trucks with legacy technology infrastructure — CMMS software that wasn't designed for multi-location operation, disconnected compliance and maintenance systems, manual reporting processes — face a difficult choice: invest in a technology platform modernization that disrupts operations during the scaling phase, or continue operating at the margin degradation that comes from the inefficiency of inadequate tools at scale.
The carriers that avoid this reinvestment problem are those that select a scalable fleet management platform at 50 to 150 trucks — one designed to serve both the small carrier's operational simplicity requirements and the enterprise carrier's data architecture and analytics requirements without requiring a platform change at any intermediate scale. FleetRabbit is designed as this type of platform: the same database architecture and feature set that serves a 50-truck regional carrier also serves a 500-truck national carrier, with role-based access controls, multi-terminal hierarchy, and analytics depth that activate as fleet complexity grows. Book a demo to review FleetRabbit's architecture against your carrier's current size and growth trajectory.
Asset Management
At 50 Trucks: Single asset registry with vehicle profiles, PM schedules, and maintenance history
At 500 Trucks: Same registry architecture scales to enterprise fleet with multi-terminal hierarchy, cross-location asset visibility, and portfolio analytics
Compliance Monitoring
At 50 Trucks: DVIR tracking, HOS visibility, and driver credential management for a manageable driver population where alerts can be reviewed individually
At 500 Trucks: Prioritized compliance alert system managing hundreds of simultaneous monitoring streams with role-based routing and escalation rules for a 500-driver organization
Preventive Maintenance
At 50 Trucks: PM schedules configured per vehicle, automated work order generation at service intervals, and basic PM compliance tracking
At 500 Trucks: Portfolio-wide PM compliance dashboard, fleet maintenance cost benchmarking by terminal, and predictive service scheduling based on accumulated vehicle data
Analytics and Reporting
At 50 Trucks: Maintenance cost per vehicle, fuel consumption reporting, and basic operational KPI visibility replacing manual spreadsheet compilation
At 500 Trucks: Real-time executive dashboard with cost-per-mile by terminal, driver performance quartile analysis, and capital expenditure modeling tied to vehicle lifecycle data
Dispatch Operations
At 50 Trucks: Vehicle availability view with maintenance status, driver HOS summary, and basic load scheduling interface
At 500 Trucks: Multi-terminal dispatch coordination with real-time vehicle position, cross-location availability view, and HOS-integrated assignment optimization across the national network
Parts and Inventory
At 50 Trucks: Parts catalog, purchase order management, and basic stockout alert for a single maintenance shop operation
At 500 Trucks: Cross-location parts inventory visibility, automatic reorder management, and fleet-wide parts spending analytics for multi-terminal maintenance operations
The Technology Investment Decision: When to Invest in Fleet Management Software During Growth
Fleet owners and executives at growing carrier companies consistently encounter the same strategic timing question: at what fleet size does investment in a comprehensive fleet management platform become justified? The instinctive answer — "when we get big enough" — is almost always too late. The operational costs of inadequate systems accumulate before the fleet reaches the size where the cost is most obviously visible, and the switching cost of moving from ad-hoc systems to a structured platform increases with fleet size as more data, processes, and people are embedded in the existing approach.
The correct timing for fleet management platform investment is earlier than most carriers believe. A carrier at 50 trucks that invests in FleetRabbit builds the operational infrastructure — asset registry, PM schedules, compliance documentation, analytics baselines — that makes each subsequent truck addition incrementally simpler rather than incrementally more chaotic. The first 50 trucks establish the data foundation that makes the next 50 trucks manageable at the same operational quality level. Carriers that wait until 150 trucks to invest in operational systems spend their first year at 150 trucks rebuilding the operational discipline that should have been established when they were at 50 trucks — while simultaneously trying to grow.
50 trucks
$180K — maintenance overruns, compliance labor, missed PM cost
Modest monthly subscription
Positive at 90 days
100 trucks
$490K — breakdown cost increase, compliance fines, reporting labor
Scales with fleet size
Positive within 60 days
200 trucks
$1.1M — CSA score impact, maintenance regression, fuel waste
Enterprise tier pricing
Positive within 45 days
350 trucks
$2.8M — compounding impact of all below-threshold cost categories
Full enterprise deployment
Positive within 30 days
The Real Costs of Scaling Without the Right Systems
Carrier owners and executives who resist investment in fleet management technology during growth phases often frame the decision as technology cost versus budget constraints. The more accurate framing is technology cost versus the accumulated costs of operating without adequate systems — costs that are real but distributed across budget categories in ways that make them difficult to attribute to the technology gap that caused them.
Maintenance Cost Escalation
Cause: PM deferrals due to scheduling visibility gaps
A carrier scaling from 100 to 300 trucks without systematic PM scheduling typically sees PM compliance rates decline from 75% to 55% during the growth phase. The resulting increase in unplanned breakdown frequency costs $800 to $1,500 per event and at 300 trucks represents 8 to 15 additional breakdown events per month versus a 90%-compliant fleet — $120K to $270K in additional annual maintenance cost.
Insurance Premium Increase
Cause: Deteriorating CSA BASIC scores during growth phase
Carriers with Vehicle Maintenance BASIC scores above the intervention threshold pay 12 to 28 percent higher commercial auto insurance premiums than carriers below the threshold. At a 300-truck carrier with a combined insurance premium of $1.2 million to $2.4 million annually, a 15 percent premium increase attributable to CSA score deterioration represents $180K to $360K in avoidable annual cost.
Compliance Labor Overhead
Cause: Manual documentation management at scale
Carriers at 200 to 350 trucks without digital compliance infrastructure typically employ 2 to 4 FTE positions whose primary function is assembling, filing, and producing compliance documentation — DVIR records, driver qualification files, maintenance records — for audits, DOT inquiries, and internal reporting. At $65K to $85K fully loaded per position, this represents $130K to $340K in annual compliance labor that automated systems largely eliminate.
Freight Revenue Risk
Cause: CSA score-based shipper screening
Major shippers and 3PLs use carrier CSA scores in their routing guide qualification criteria. Carriers with elevated BASIC scores in Vehicle Maintenance, HOS Compliance, or Driver Fitness are excluded from preferred carrier programs that provide rate premiums and consistent freight commitments. For a carrier scaling to 300 trucks, losing preferred carrier status with two to three major shippers due to CSA score deterioration can represent $4M to $10M in annual freight revenue at risk.
Asset Underutilization
Cause: Maintenance downtime during growth-phase operational confusion
During rapid fleet growth without systematic maintenance management, vehicle availability rates frequently decline from 94 to 96 percent (achievable with good PM programs) to 88 to 91 percent (common during growth phase maintenance regression). At 200 trucks with a revenue basis of $800 per available truck per day, a 5 percentage point availability decline costs the carrier $2.9M annually in foregone vehicle utilization.
Management Decision Quality
Cause: Lagged, fragmented operational data
Fleet executives making capital expenditure decisions — when to replace vehicles, which terminals to expand, which lanes to pursue — based on 30-day-old, manually compiled operational data consistently make allocation decisions that underperform the decisions they would make with real-time, accurate operational data. While this cost is harder to quantify precisely, operational research consistently attributes 4 to 8 percent of capital expenditure inefficiency to decision quality degradation from poor data infrastructure.
Building the Operational Infrastructure for Each Growth Stage
The specific configuration of FleetRabbit that serves a carrier well at 50 trucks differs from the configuration that maximizes value at 500 trucks — not because the platform changes, but because the operational priorities and data utilization patterns change with fleet size. Understanding which platform capabilities to activate and emphasize at each stage of growth ensures that the investment in fleet management technology delivers maximum value at every stage rather than being partially utilized because the carrier has not yet reached the scale where certain capabilities are operationally relevant.
Activate First
Asset registry — all vehicles with specification, registration, and PM schedule
Digital DVIR — replace paper inspection reports with smartphone-based completion
PM work order automation — PM triggers generate work orders without dispatcher initiation
Driver qualification file management — CDL, medical certificate, drug test records centralized
Activate Later
Multi-terminal hierarchy — not needed until second terminal is established
Advanced analytics — limited data volume before 90-day operational baseline is established
Activate Now
Multi-terminal visibility — terminal-level dashboards for location-based managers
HOS monitoring alerts — automated notifications prevent HOS violations at driver scale
Fuel card integration — consolidated fuel data reveals efficiency patterns at fleet scale
Parts and inventory management — prevents stockouts and redundant purchasing across locations
Compliance dashboards — DVIR completion rate and PM compliance rate reviewed in weekly ops meetings
Building Toward
Portfolio-level analytics — monthly review establishes benchmark data for next stage comparison
Full Platform Utilization
Executive KPI dashboard — real-time portfolio analytics reviewed in weekly leadership meetings
Driver performance analytics — quartile analysis, HOS compliance by driver, coach bottom performers
Capital expenditure modeling — vehicle lifecycle data from FleetRabbit informs replacement schedule decisions
Cross-terminal benchmarking — terminal performance compared against fleet average on all key metrics
Corrective action programs — systematic compliance remediation with documented accountability trails
Optimization Focus
This is continuous improvement mode — the platform infrastructure is complete, now it drives operational excellence
Key Performance Metrics at Each Scale: What Good Looks Like
One of the most valuable outputs of a structured fleet management platform for a growing carrier is the establishment of clear operational benchmarks — performance metrics that define what "good" looks like at each fleet scale and provide the measurement framework to evaluate whether current performance is consistent with a carrier that is scaling successfully or one that is scaling into increasing operational dysfunction.
| Performance Metric |
50-100 Trucks |
100-250 Trucks |
250-500 Trucks |
| Vehicle Availability Rate |
Target: 93-96% |
Target: 92-95% |
Target: 94-97% (systems enable higher rate) |
| PM Compliance Rate |
Target: 82-88% |
Target: 85-90% |
Target: 88-94% |
| DVIR Completion Rate |
Target: 90-95% |
Target: 93-97% |
Target: 96-99% |
| Planned vs. Reactive Maintenance |
Target: 70% planned |
Target: 74% planned |
Target: 80%+ planned |
| Unplanned Breakdowns per 100 Vehicles |
Target: Below 3.5/month |
Target: Below 2.8/month |
Target: Below 2.0/month |
| HOS Violation Rate per Driver |
Target: Below 2%/month |
Target: Below 1.5%/month |
Target: Below 1%/month |
Frequently Asked Questions
QAt what fleet size does it become genuinely necessary to invest in a comprehensive fleet management platform rather than managing with spreadsheets and informal systems?
The honest answer is that the investment becomes justifiable at 30 to 40 trucks — significantly smaller than most carrier owners believe. At this fleet size, the monthly cost of a platform like FleetRabbit is smaller than the monthly preventable maintenance cost from a single unplanned breakdown avoided by better PM scheduling. The practical threshold where the consequences of inadequate systems become operationally visible is around 75 to 100 trucks — when driver count, compliance documentation volume, and maintenance work order frequency exceed the capacity of informal systems to manage reliably. However, carriers that wait until informal systems visibly break before investing are already paying the accumulated cost of those inadequate systems. The optimal timing is investment before the operational stress of growth makes implementation difficult — at 50 to 75 trucks with a clear growth trajectory toward 150 trucks or beyond.
QHow long does it take to deploy FleetRabbit across a growing carrier network when trucks and terminals are being added continuously?
FleetRabbit's mobile-first architecture allows new vehicles and terminals to be added to the platform in hours rather than days or weeks. When a carrier adds a truck to the fleet, the vehicle is registered in FleetRabbit's asset registry using the mobile app — asset profile, specification data, PM schedule — in under 30 minutes. When a new terminal is established, the terminal is added to the organizational hierarchy in FleetRabbit, users are provisioned with appropriate role-based access, and the terminal's vehicles are assigned to the new location. There is no IT implementation project required for each addition — the platform architecture is designed for continuous expansion. Growing carriers typically find that the ongoing maintenance of a FleetRabbit deployment during a growth phase requires less operational overhead than maintaining a paper-based or spreadsheet-based system — because the platform handles data organization automatically rather than requiring manual file management for each new vehicle and driver added.
QWhat is the most common operational mistake carriers make when scaling from 100 to 300 trucks that FleetRabbit helps prevent?
The most common and costly mistake is neglecting preventive maintenance schedule consistency during the growth phase. When a carrier is adding trucks at a rapid pace — 10 to 20 per month — the logistics of maintaining PM schedules for the existing fleet while onboarding new trucks into the maintenance program creates a volume of scheduling work that informal systems cannot handle without deferrals. PM deferrals accumulate invisibly in paper-based or spreadsheet systems — there is no automated alert when a PM interval is missed for a vehicle that was recently added and doesn't yet have a strong PM history. Over 12 to 18 months of growth-phase PM deferral, the breakdown rate of the newer additions to the fleet is significantly higher than the established vehicles that received consistent PM treatment — a pattern that only becomes visible in maintenance cost analysis when the damage is already done. FleetRabbit prevents this by automatically scheduling PM work orders for newly added vehicles based on the PM template for the vehicle type from the moment the asset is registered — no manual scheduling required, no deferrals unless the maintenance manager explicitly approves a deferral with documented justification.
QHow does FleetRabbit handle the transition when a carrier acquires another carrier's fleet and needs to integrate vehicles, drivers, and maintenance records from a different system?
Fleet acquisition integration is one of the specific deployment scenarios FleetRabbit supports with dedicated data migration tools. Vehicles from the acquired fleet can be imported to FleetRabbit's asset registry via CSV — including historical maintenance records, current PM status, and vehicle specifications — from virtually any prior system that allows data export. Drivers from the acquired fleet are added to team management with their qualification file records, HOS history where available, and operational assignments. The acquired fleet's terminal or operational location is added to the organizational hierarchy with appropriate access permissions for both the acquired fleet's existing management and the acquiring carrier's oversight structure. Most carrier acquisition fleet integrations in FleetRabbit complete the basic asset and driver registration within the first two weeks of deployment, with historical data import and PM schedule configuration completed in weeks three and four.
Book a demo to discuss the specific integration requirements for your carrier's current acquisition or growth scenario with the FleetRabbit team.
QWhat does the transition look like for a carrier moving from a legacy CMMS to FleetRabbit during active fleet growth?
The transition from a legacy CMMS to FleetRabbit during active growth is designed to operate in parallel for a defined period rather than requiring a cutover date. Legacy CMMS data — vehicle records, work order history, PM schedules — is exported and imported to FleetRabbit during the first two weeks. New work orders and inspections begin in FleetRabbit while the legacy system remains accessible for historical record reference. Typically within 45 to 60 days of deployment, all new operational data is being created in FleetRabbit and the legacy system transitions to read-only archive status. The advantage of this approach for a carrier in active growth mode is that the transition does not require freezing operational activity or intensifying labor demands during the implementation period. Growth-phase truck additions are registered directly in FleetRabbit from day one — the new fleet additions benefit immediately from the structured PM scheduling and compliance monitoring that the growing carrier needs most.
Build the Fleet Management Infrastructure That Grows With You — From 50 Trucks to 500 and Beyond
FleetRabbit's platform scales with your carrier without platform changes at any growth threshold. The operational foundation you establish today at 50 trucks is the same infrastructure serving your 500-truck operation — with visibility, compliance, and analytics depth that activates automatically as your fleet grows.
Scalable Fleet Architecture
Multi-Terminal Management
Growth-Stage Analytics
Compliance at Scale
PM Scheduling Automation
Executive Dashboards
April 21, 2026
By Jason Smith
All Posts