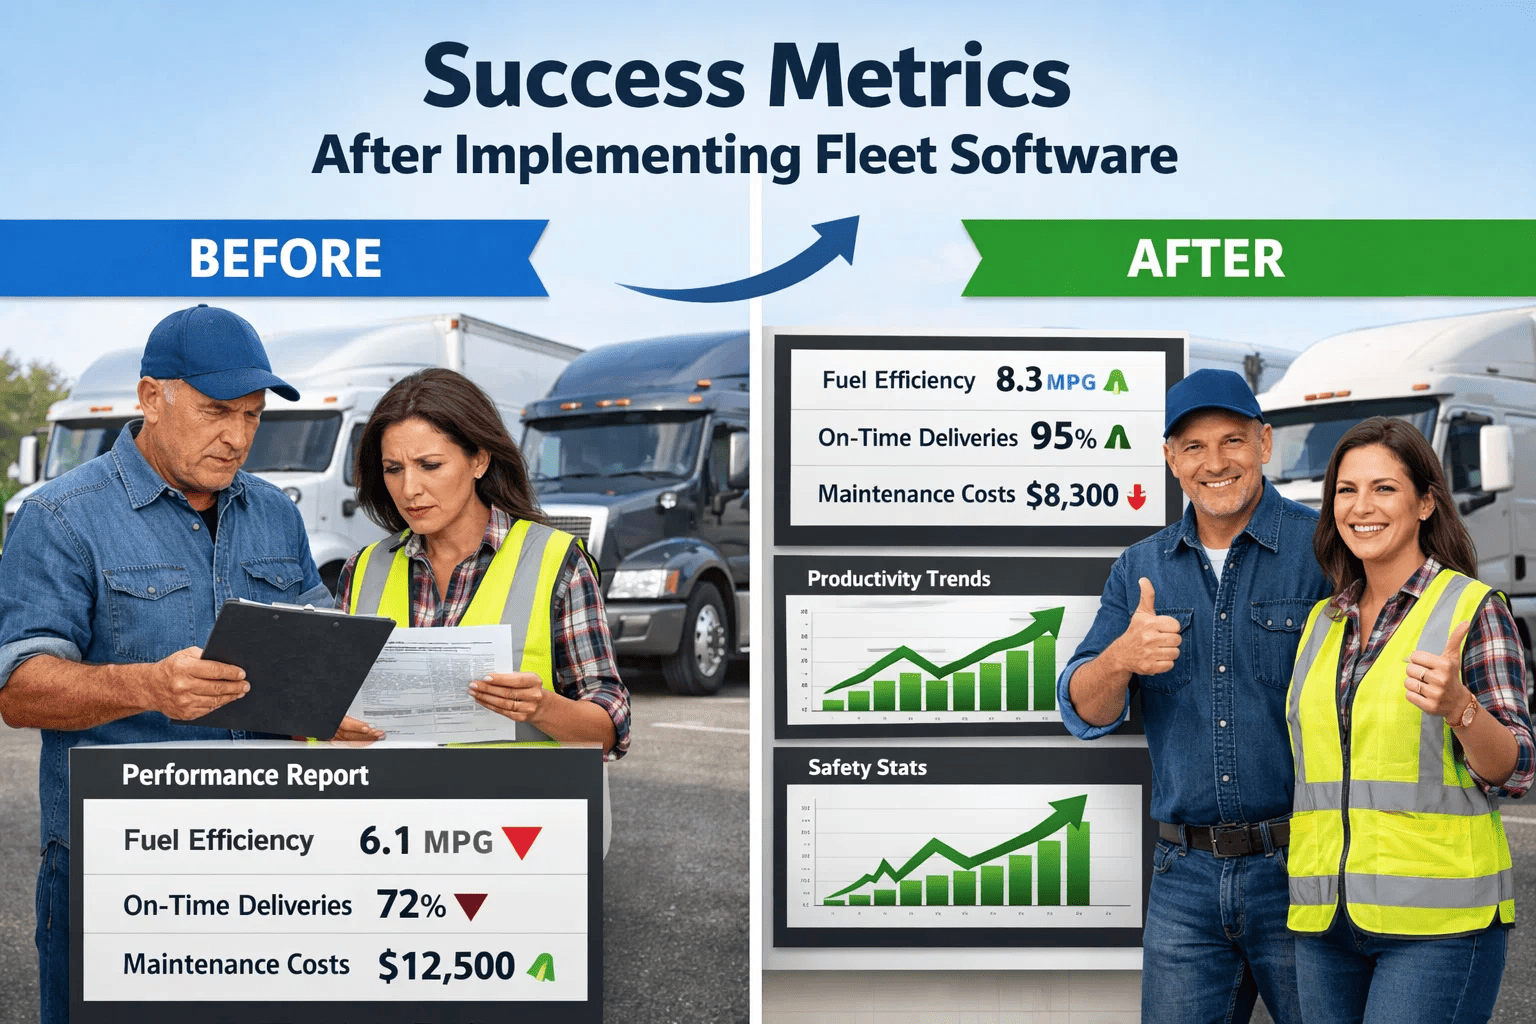
Fleet management software investments are justified during the sales process with projected ROI numbers — reduced fuel costs, fewer violations, lower accident rates, decreased maintenance spend. But the difference between a successful implementation and an underperforming technology investment is measured not in projections but in actual, documented performance changes after deployment. Fleet managers and operations executives need a rigorous framework for measuring what actually changed, quantifying the financial impact, and identifying where additional optimization is possible. This case study framework documents exactly how high-performing fleets measure success after implementing FleetRabbit — and what outcomes they consistently achieve within 90, 180, and 365 days of deployment. Book a demo to see FleetRabbit's ROI methodology for your fleet size and segment.
Fleet Software Case Study
Success Metrics After Implementing Fleet Management Software: How to Measure ROI, Track Performance Improvements, and Quantify Operational Gains From FleetRabbit
FLEET SOFTWARE ROI & PERFORMANCE ANALYSIS
What Fleet Operations Actually Achieve After Implementing Fleet Management Software
ROI projections explain why fleets buy software. Documented outcomes explain why they keep it and expand it. This performance analysis framework tracks the metrics that matter — fuel cost reduction, accident rate improvement, compliance score gains, and maintenance spend optimization — across 30, 90, and 365-day implementation milestones.
Day 1–30
Foundation
Baseline established, first data insights, quick wins visible
→
Day 31–90
Acceleration
Behavior changes measurable, cost reductions emerging
→
Day 91–365
Optimization
Full ROI visible, compound improvements compounding
Step 1: Establish Your Pre-Implementation Baseline
ROI cannot be measured without an accurate baseline. Before FleetRabbit deployment, document the current state of every metric you intend to track as a success indicator. Fleets that skip baseline documentation cannot credibly attribute improvements to the software investment — or identify areas where expected gains didn't materialize and require additional intervention.
Financial Baseline Metrics
Monthly fuel spend per vehicle
Pull from fuel card system — 90-day average to control for seasonality
Monthly maintenance spend per vehicle
Planned service + unplanned repair from accounts payable — separate the two
Emergency repair incidents per month
Count roadside breakdowns and unplanned shop visits from maintenance records
Administrative hours per week for compliance
Time-track compliance preparation, audit assembly, and reporting activities
Operational Baseline Metrics
Average miles per gallon (fleet)
Total miles driven divided by total gallons purchased — 90-day calculation
Idle time percentage
Engine hours vs. moving hours from existing ELD if available — estimate if not
DVIR completion rate
Count inspections completed vs. inspection opportunities for past 90 days
On-time delivery performance
TMS delivery records — on-time arrivals as percentage of total deliveries
Safety and Compliance Baseline
HOS violations per 100 driver-days
ELD violation log from prior 6 months — normalize to per-driver rate
Preventable accident rate
Accident records for prior 12 months — separate preventable from non-preventable
CSA score by BASIC category
SMS portal — download current CSA percentile by BASIC at implementation date
Driver turnover rate (annual)
HR records — departures divided by average headcount for trailing 12 months
Days 1–30: Foundation Period Outcomes
What Changes Immediately
Real-time vehicle location visible to all dispatchers — call volume for status updates drops 60-80%
Digital DVIR completion rates typically increase from 60-74% to 90%+ within first 2 weeks
HOS violation pre-alerts begin surfacing — drivers notified before violations occur
First fuel efficiency reports reveal which drivers and vehicles are farthest from benchmark
Metrics to Track at Day 30
DVIR completion rate vs. pre-deployment baseline — target: 95%+ within 30 days
HOS pre-violation alert utilization — percentage of drivers receiving and responding to alerts
Dispatch productivity — loads assigned per hour as dispatchers gain real-time vehicle visibility
Platform adoption rate — percentage of drivers actively using FleetRabbit mobile application
60–80%
Reduction in status check calls to drivers
25%+
Increase in DVIR completion rate
100%
Visibility into fleet location in real time
Days 31–90: Acceleration Period Outcomes
Fuel and Operations
Idle time reduction of 8-15 percentage points as drivers receive consistent idle behavior feedback
Hard braking and rapid acceleration events down 25-40% from baseline following coaching interventions
Fuel economy improvements of 0.3-0.7 MPG fleet-wide from behavior change alone (before route optimization)
Emergency repair incidents begin declining as maintenance alerts prompt scheduled intervention
Compliance and Safety
HOS violations down 45-65% as pre-alert system intercepts drivers before clock violations occur
Open vehicle defects resolved 40% faster as digital work order routing eliminates communication delays
Compliance calendar prevents expiring medical certificates and CDL renewals from being missed
Roadside inspection pass rate improving as open DVIR defects addressed before inspections occur
0.5 MPG
Average fleet fuel economy gain by day 90
55%
Average HOS violation rate reduction
35%
Fewer hard braking and rapid acceleration events
See What Your Fleet Would Achieve in the First 90 Days
FleetRabbit's ROI modeling tool calculates expected savings for your fleet size, segment, and operational profile — based on actual outcomes from fleets like yours. See projected fuel savings, compliance cost avoidance, and maintenance reduction before you sign anything. Book a ROI planning session with our team.
Days 91–365: Optimization Period Outcomes
Fuel Cost Reduction
12–18% annual fuel cost reduction
Combination of MPG improvement from behavior change (0.5-0.9 MPG), idle time reduction (8-15 percentage points), and route optimization for deadhead elimination. For a 50-truck fleet spending $1.8M annually on fuel, 15% reduction equals $270,000 annual savings.
Maintenance and Downtime
38–52% reduction in emergency repair costs
Predictive maintenance alerts prevent failures before they become emergency repairs. Planned maintenance cost typically increases slightly (more proactive service) while emergency repair cost drops dramatically. Net maintenance spend decreases 18-24% while vehicle availability increases 8-12 percentage points.
Compliance and Safety
$85K–$140K in compliance cost avoidance
HOS violations prevented, roadside OOS citations avoided, FMCSA fines not incurred, and insurance premium reductions from improved CSA scores. A single prevented DOT violation saves $8,900 on average. Preventing 10-15 violations annually pays for compliance management infrastructure.
Driver Retention
15–28% reduction in annual driver turnover
Drivers in environments with clear performance standards, consistent coaching, and transparent data perform better and stay longer. Reduced turnover at $10,000 per departure: a 50-truck fleet reducing turnover from 85% to 62% prevents 11-12 departures annually, saving $110,000-$120,000 in replacement costs.
Documented ROI Calculation Framework
Maintenance Cost Reduction Calculation
Compliance Cost Avoidance Calculation
Administrative Efficiency Calculation
Industry Case Study Pattern: 100-Truck Regional Carrier, 12-Month Results
Fleet Fuel Economy
6.1 MPG average
6.9 MPG average
$312,000 annual fuel savings
Emergency Repairs
11 incidents/year
3 incidents/year
$104,000 repair cost reduction
HOS Violations
3.4 per 100 driver-days
0.31 per 100 driver-days
$87,200 in fines avoided
Idle Time
31% of engine hours
14% of engine hours
$68,000 idle fuel cost reduction
Driver Turnover
91% annual rate
58% annual rate
$330,000 in replacement cost savings
Total Documented ROI
Pre-Software Baseline
12-Month Performance
$901,200 annual value delivered
Frequently Asked Questions: Fleet Software ROI
QHow quickly does FleetRabbit typically pay for itself?
Most fleets document positive ROI within 45 to 90 days of full deployment. The fastest-payback areas are compliance fine avoidance (immediate) and fuel savings from idle reduction and behavior coaching (measurable within 30-45 days). Full-year documented ROI consistently ranges from 8 to 14 times the annual platform cost for fleets of 50 or more vehicles.
QWhat if our fleet doesn't see the projected fuel efficiency gains?
Fuel efficiency gains depend on baseline behavior and management follow-through on coaching. Fleets that use FleetRabbit's driver coaching tools consistently see larger fuel gains than fleets that use the data only for reporting without behavioral intervention. If fuel gains are below expectation at 60 days, FleetRabbit's customer success team conducts coaching program review and identifies specific drivers or routes where intervention has not been applied.
QHow do we attribute improvement to FleetRabbit versus other factors like fuel prices or seasonal patterns?
Attribution methodology matters. Compare same period year-over-year where possible. Control for fuel price changes by measuring gallons consumed rather than dollars spent. Control for seasonality by comparing quarterly results to the same quarter in prior years. FleetRabbit's performance reports include period-over-period comparisons with the ability to normalize for external variables. Where possible, compare your fleet's performance trend against industry benchmark trends in the same period.
QHow should we present fleet software ROI to executives who approved the investment?
Build a one-page summary showing: (1) platform investment cost, (2) documented savings by category with methodology for each, (3) total calculated ROI multiple, and (4) non-quantified benefits including improved compliance posture, safety score improvement, and operational visibility gains. FleetRabbit's executive reporting module generates this summary automatically from performance data — requiring no manual spreadsheet assembly for the board or CFO update.
QWhat's the single biggest ROI driver most fleets underestimate before implementation?
Driver retention improvement consistently generates more financial value than fleets initially project. Most ROI models focus on fuel and maintenance because those costs are visible and measurable. Driver turnover cost of $8,000 to $12,000 per departure — including recruiting fees, training time, productivity ramp-up, and insurance rate impact of new drivers — is rarely quantified rigorously. Fleets that reduce turnover from 85% to 55% on a 100-driver fleet save $240,000 to $360,000 annually in replacement costs alone, often exceeding the platform investment independently.
Fleet management software is a capital commitment that deserves rigorous performance measurement. The fleets that achieve the highest ROI from FleetRabbit are not the ones with the most technology-forward cultures — they are the ones that establish accurate baselines before deployment, track performance changes systematically against those baselines, and use performance data to drive consistent management action on the issues the data surfaces.
The investment thesis for fleet management software is straightforward: operational visibility enables intervention, and intervention at scale compounds into substantial cost reduction, risk mitigation, and efficiency gains. The framework, benchmarks, and case study patterns in this guide provide the measurement infrastructure to prove that thesis with your actual fleet data.
Start Measuring What Your Fleet Can Save With FleetRabbit
FleetRabbit's ROI calculator provides a personalized performance projection based on your fleet size, segment, and current operational metrics. See what fuel savings, compliance cost avoidance, and maintenance reduction your operation can realistically achieve — before you make any commitment.
Fleet ROI Measurement
Fuel Savings Tracking
Compliance Cost Avoidance
Driver Retention Analytics
Maintenance Cost Reduction
April 15, 2026
By Nathan Smith
All Posts