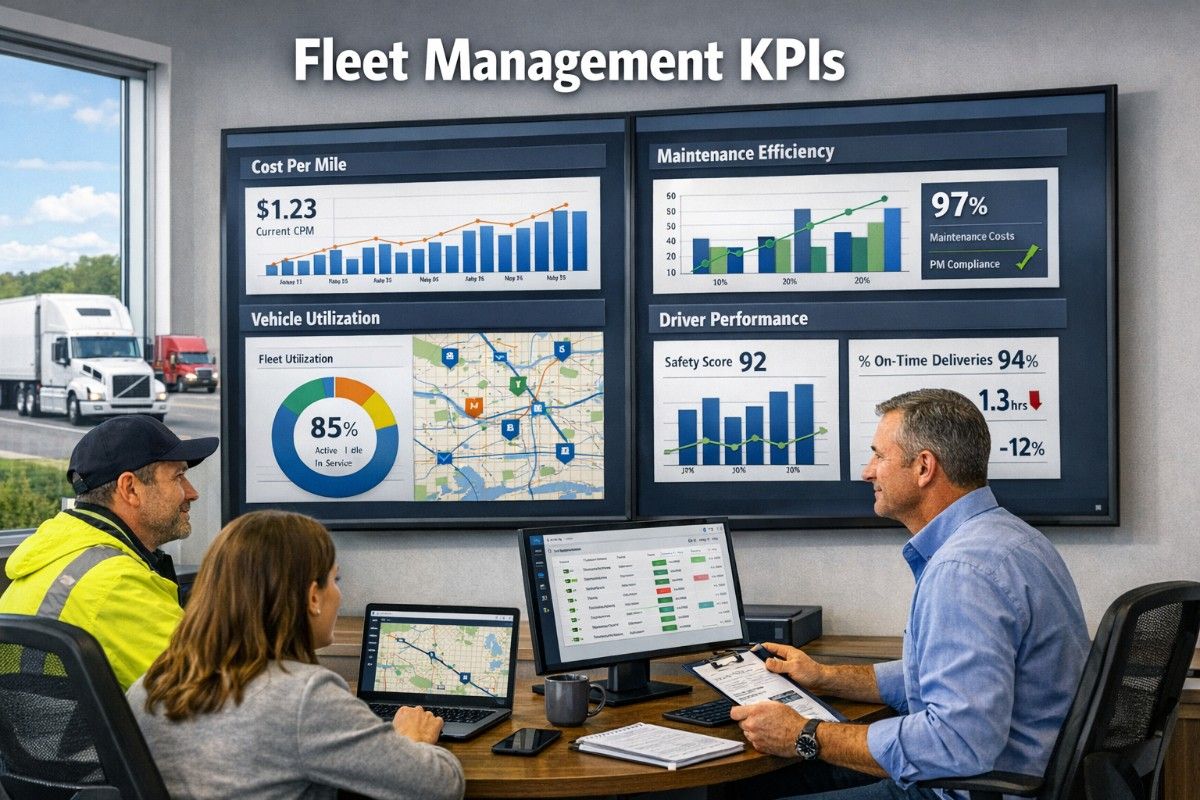
Fleet managers navigate a complex operational environment where fuel prices fluctuate, driver retention challenges persist, maintenance costs rise with vehicle age, and customer expectations for on-time delivery continue to tighten — yet many managers lack the structured key performance indicator framework that would enable them to measure, analyze, and improve performance across these competing dimensions. Tracking the right fleet management KPIs transforms fleet operations from reactive problem-solving to data-driven performance management, providing visibility into vehicle utilization rates, cost per mile trends by asset class, maintenance efficiency metrics that predict rather than react to failures, driver performance indicators that improve safety and fuel economy, and customer service measurements that directly affect revenue retention. This guide presents the essential fleet management KPIs across five performance dimensions — financial efficiency, asset utilization, maintenance effectiveness, driver performance and safety, and customer service — with specific calculation methodologies, industry benchmark ranges, and actionable intervention protocols when metrics fall outside acceptable ranges. FleetRabbit's analytics suite provides real-time KPI dashboards with automated calculation, trend analysis, and configurable alerting when metrics deviate from target ranges.
Guide Summary
Effective fleet management requires tracking KPIs across five performance dimensions: financial efficiency (cost per mile, cost per hour, fuel cost per mile, maintenance cost per mile, total cost of ownership per vehicle), asset utilization (vehicle utilization rate, empty miles percentage, dwell time, asset availability, fleet turnover rate), maintenance effectiveness (preventive maintenance compliance, mean time between failures, mean time to repair, first-time fix rate, roadside breakdown frequency), driver performance and safety (fuel efficiency by driver, idle time percentage, safety score, on-time performance, driver retention rate), and customer service (on-time delivery percentage, tender acceptance rate, claims ratio, customer satisfaction score). Each KPI requires specific calculation methodology, consistent data sources, defined target ranges, and documented response protocols when metrics fall out of tolerance. FleetRabbit's KPI dashboard provides real-time visibility across all five dimensions with automated alerts and trend analysis.
Financial Efficiency KPIs
Financial efficiency metrics provide the primary scorecard for fleet operational health because they translate operational performance directly into profit and loss impact. These KPIs answer the fundamental question: is this fleet operation generating appropriate economic value from its asset base and operating activities? The most widely benchmarked financial KPI in fleet management is cost per mile — total operating cost divided by total miles traveled across a defined period, typically calculated monthly and rolling 12-month average. The calculation includes all variable operating costs (fuel, maintenance repairs, tires, tolls, driver wages if paid by mile) and appropriate allocations of fixed costs (insurance, licensing, technology subscriptions, administrative overhead) depending on the measurement purpose. Industry benchmark ranges for cost per mile vary significantly by fleet segment — dry van truckload carriers typically target 1.40 to 1.70 dollars per mile; refrigerated carriers add 0.10 to 0.15 dollars per mile for reefer fuel and maintenance; less-than-truckload carriers use cost per hundredweight or cost per stop as primary metrics rather than per-mile measures.
Cost per mile must be segmented by vehicle class, age, and operating application to produce actionable management insights. A fleet's average cost per mile across all vehicles obscures the variation between newer and older assets, between long-haul and regional routes, and between high-utilization and low-utilization vehicles. Effective cost per mile reporting includes variance analysis comparing actual costs to budgeted costs, trend analysis showing cost per mile movement over time against fuel price indices and maintenance inflation, and vehicle-level ranking that identifies outliers requiring investigation. The companion KPI of cost per operating hour becomes relevant for fleets with significant idle or low-speed operation (construction, municipal, refuse, local delivery) where per-mile metrics understate cost intensity. Cost per operating hour is calculated as total operating cost divided by total engine hours or operating hours from telematics data. FleetRabbit's financial analytics module calculates cost per mile and cost per hour automatically from integrated fuel, maintenance, payroll, and telematics data — segmented by vehicle, driver, route type, and time period with benchmark comparisons.
Cost Per Mile (CPM)
Formula: (Total Operating Costs) / (Total Miles Traveled)
Components: Fuel + Maintenance + Tires + Tolls + Driver Wages (mileage pay) + Insurance Allocation + Licensing Allocation + Overhead Allocation
Dry Van Benchmark: 1.40 - 1.70 per mile
Refrigerated Benchmark: 1.55 - 1.90 per mile
Flatbed Benchmark: 1.50 - 1.85 per mile
Intervention Trigger: CPM exceeds budget by more than 5 percent for two consecutive months — investigate fuel pricing, unplanned maintenance, or route efficiency
Fuel Cost Per Mile
Formula: (Total Fuel Expenditure) / (Total Miles Traveled)
Components: Gallons purchased x price per gallon — includes on-road diesel, gasoline, alternative fuels, EV charging costs
Class 8 Benchmark: 0.40 - 0.55 per mile (varies with fuel price)
Class 3-6 Benchmark: 0.25 - 0.40 per mile
MPG Equivalent: 6.0 - 8.0 mpg typical for Class 8 linehaul
Intervention Trigger: Fuel CPM increases more than 10 percent period over period after controlling for fuel price — examine driver behavior, vehicle aerodynamics, tire pressure, route topology
Maintenance Cost Per Mile
Formula: (Total Maintenance Expenditure) / (Total Miles Traveled)
Components: Parts + Labor + Third-party vendor repairs + Internal shop costs — excludes capitalized major component replacements
Class 8 Benchmark (Year 1-3): 0.05 - 0.08 per mile
Class 8 Benchmark (Year 4-6): 0.09 - 0.14 per mile
Class 8 Benchmark (Year 7+): 0.15 - 0.22 per mile
Intervention Trigger: Vehicle-level maintenance CPM exceeds age-based benchmark by 30 percent — conduct vehicle inspection, evaluate replacement versus repair decision
Total Cost of Ownership (TCO) Per Vehicle
Formula: Acquisition Cost + Operating Costs (life to date) + Maintenance Costs (life to date) + Fuel Costs (life to date) + Disposal Cost — Salvage Value
Calculation Period: Typically calculated at disposal or annually for active assets
Use Case: Vehicle replacement timing decisions, make-model comparison, lease versus buy analysis
Analysis Framework: TCO per mile trend indicates optimal replacement age — when annual TCO per mile increases, vehicle has passed economic replacement point
Asset Utilization KPIs
Fleet assets represent significant capital investment — a single Class 8 tractor may cost 150,000 to 200,000 dollars new, and each day that asset sits idle erodes the return on that capital. Asset utilization KPIs measure how effectively the fleet converts capital investment into revenue-generating activity, identifying underutilized assets that should be redeployed, shared, or sold and overutilized assets that risk accelerated wear and reliability issues. The primary utilization metric is vehicle utilization rate — the percentage of available time that a vehicle is engaged in revenue-generating activity — calculated as (Revenue-Producing Hours or Miles) / (Total Available Hours or Miles). Available hours for linehaul operations is typically 24 hours per day minus required driver rest, while local operations may calculate available hours as scheduled operating hours. Industry benchmarks for utilization vary dramatically by segment: linehaul truckload carriers target 65 to 75 percent utilization (reflecting time spent moving under load versus waiting, empty repositioning, and driver rest); less-than-truckload operations typically achieve 55 to 65 percent utilization; dedicated contract carriage can exceed 80 percent utilization due to predictable schedules and reduced empty miles.
Empty miles percentage is a critical utilization sub-metric specific to for-hire carriers — the proportion of total miles driven without revenue-producing cargo, calculated as (Empty Miles) / (Total Miles). Empty miles represent pure operating cost without offsetting revenue, consuming fuel, driver wages, maintenance, and asset life without contribution. Industry best-in-class empty miles are 5 to 8 percent for dedicated and contractual operations with balanced freight networks; average truckload carriers operate with 12 to 18 percent empty miles; carriers lacking backhaul networks may exceed 25 percent empty miles. Dwell time — the time a vehicle spends at customer facilities for loading and unloading — affects both utilization and driver compensation. Excessive dwell time reduces revenue-producing hours and increases driver frustration. Dwell time measured from arrival to departure at shipper and receiver facilities; benchmarks vary by facility type, with drop-and-hook operations achieving one hour or less and live-load operations ranging two to four hours. Dwell time exceeding four hours triggers customer conversation about loading efficiency and potential accessorial charges to compensate for driver waiting time.
Vehicle Utilization Rate
Linehaul Truckload Operations
Formula: Revenue Miles / (24 hours - Driver Rest - Available Hours Adjustment)
Target Range: 65 - 75 percent utilization
Poor Below 55 percent
Excellent Above 80 percent
Local and Regional Operations
Formula: Revenue Hours / Scheduled Operating Hours
Target Range: 70 - 80 percent productive time
Improvement Levers: Route optimization, reduced wait time, cross-dock efficiency
Empty Miles Percentage
Calculation and Benchmarks
Formula: (Empty Miles) / (Total Miles) x 100
Best-in-Class: 5 - 8 percent
Industry Average: 12 - 18 percent
Intervention Required: Above 20 percent persistently
Reduction Strategies
Load board optimization for backhaul freight
Dedicated lane development with balanced freight flows
Collaborative networks and freight exchange participation
Dwell Time
Measurement and Benchmarks
Formula: (Departure Time - Arrival Time) at facility
Drop-and-Hook Target: Under 60 minutes
Live Load Target: 120 - 180 minutes
Intervention Required: Above 240 minutes at any facility
Driver Impact
Excessive dwell time reduces driver compensation for mileage-paid drivers
Driver turnover correlation with chronic dwell time issues at specific facilities
Maintenance Effectiveness KPIs
Maintenance effectiveness metrics distinguish fleets that manage maintenance proactively from those that react to breakdowns — and the difference appears directly on the profit and loss statement through roadside repair costs, tow expenses, customer service failures, and asset life extension. Preventive maintenance compliance is the foundational maintenance KPI: the percentage of scheduled PM services completed within the specified mileage or time window. Calculation is (PM Services Completed On Time) / (Total PM Services Due) for the measurement period. Industry best practice targets 95 percent or higher PM compliance for linehaul fleets; compliance below 90 percent indicates scheduling, capacity, or prioritization issues that will manifest as increased breakdown frequency typically six to twelve months after the compliance failure. PM compliance must be tracked by vehicle to identify individual assets or maintenance facilities with chronic non-compliance.
Mean time between failures (MTBF) measures the average operating interval between unplanned mechanical failures that require unscheduled maintenance intervention or cause roadside breakdowns. Calculation is (Total Operating Hours or Miles) / (Number of Unscheduled Failures) over a defined period. MTBF increases when preventive maintenance is effective, component quality is appropriate for application, and vehicles are replaced before failure-prone age. Industry benchmarks for Class 8 tractors: excellent MTBF exceeds 25,000 miles between unscheduled failures; average MTBF ranges 12,000 to 18,000 miles; intervention required when MTBF falls below 8,000 miles. Mean time to repair (MTTR) measures maintenance responsiveness and efficiency: (Total Downtime Hours for Unscheduled Repairs) / (Number of Unscheduled Repairs). MTTR below eight hours for linehaul fleets indicates effective parts availability, technician skill, and repair process efficiency; MTTR exceeding 24 hours suggests parts procurement delays, insufficient technician capacity, or complex diagnosis requirements. First-time fix rate — the percentage of repairs that resolve the issue without return visits or repeat repairs — measures maintenance quality and diagnosis accuracy; target exceeds 90 percent for most repair categories. FleetRabbit's maintenance analytics tracks all five maintenance KPIs automatically from work order data, with vehicle-level MTBF trending and repair frequency by component category.
Preventive Maintenance Compliance
Calculation
On-Time PM Completions / Total PM Services Due x 100
Target: 95 percent or higher for linehaul
Intervention Protocol
Below 90 percent: Audit PM scheduling and shop capacity
Vehicle-specific non-compliance: Review driver vehicle inspection report quality and vehicle assignment
Mean Time Between Failures
Calculation
Total Operating Miles / Number of Unscheduled Failures
Class 8 Target: Above 20,000 miles MTBF
Intervention Protocol
Declining MTBF trend: Investigate component failure patterns
Vehicle below 10,000 miles MTBF: Consider replacement or comprehensive overhaul
First-Time Fix Rate
Calculation
Repairs Resolved on First Visit / Total Repair Visits x 100
Target: Above 90 percent for routine repairs
Intervention Protocol
Repeat repairs for same symptom: Diagnose root cause, technician training need, or incomplete repair process
Driver Performance and Safety KPIs
Driver performance directly affects fuel economy, vehicle wear, safety outcomes, customer satisfaction, and regulatory compliance — making driver-focused KPIs essential for fleet performance management. Fuel efficiency by driver, measured as miles per gallon or gallons per mile, isolates the driver's contribution to fuel consumption from vehicle factors, route characteristics, and load effects. Calculation requires fuel purchase or telematics fuel consumption data linked to driver assignment for specific trips or time periods. MPG variance between top and bottom quartile drivers within the same fleet, vehicle type, and route category typically ranges 15 to 25 percent — representing significant fuel cost savings opportunity through driver training, incentive programs, and coaching. Best-practice fleets share individual MPG performance data with drivers weekly, with top performers recognized and bottom quartile drivers receiving targeted coaching or refresher training.
Idle time percentage measures the proportion of engine-on time that the vehicle is stationary with engine running but not moving — calculated as (Engine Idle Hours) / (Total Engine Hours). Excessive idling wastes fuel, adds engine wear hours without producing miles, and increases emissions. Industry targets for idle time vary by season and operation type: linehaul fleets typically target idle time below 10 percent of total engine hours (including necessary HVAC idle for driver rest); best-in-class fleets achieve three to five percent idle time through auxiliary power units, automatic engine shutdown programming, and driver behavior modification. Safety score composites track relevant safety metrics including collisions per million miles, preventable accident rate, inspection violations per roadside inspection, and hard braking or following distance events from telematics data. Driver safety scores inform coaching, qualification for preferred freight, incentive program eligibility, and termination decisions for drivers with chronic safety issues. Driver retention rate — the percentage of drivers remaining with the fleet over a defined period — serves as both a performance metric and a leading indicator of broader operational health. Industry annual driver turnover in truckload segments historically ranges 70 to 100 percent, making retention a critical cost driver. FleetRabbit's driver performance dashboard integrates fuel efficiency, idle time, safety events, and on-time performance in a single driver scorecard with trend analysis and peer benchmarking.
Fleet performance ultimately serves customer requirements — and customer service KPIs connect operational metrics to revenue retention and growth. On-time delivery percentage is the primary customer-facing KPI: the percentage of deliveries completed within the customer-specified delivery window, calculated as (On-Time Deliveries) / (Total Deliveries) x 100. Industry standard target is 95 percent on-time for most freight segments, with premium and just-in-time operations requiring 98 percent or higher. On-time delivery measurement requires clear definition of delivery window boundaries, consistent arrival time capture (typically from electronic proof of delivery or telematics arrival timestamp), and exclusion of customer-caused delays unless the customer accepts responsibility. Declining on-time delivery percentage reliably predicts customer churn and should trigger root cause analysis across dispatch, driver performance, maintenance reliability, and customer communication processes.
Tender acceptance rate measures the percentage of offered loads that the carrier accepts, reflecting capacity management effectiveness and customer relationship health. Calculation is (Accepted Tenders) / (Total Tenders Received) x 100. Low acceptance rates damage customer relationships and may trigger reduction in freight offered. Target acceptance rates vary by relationship type: dedicated contract carriage targets 95 percent or higher; spot market carriers operate 60 to 80 percent acceptance based on rate negotiation. Claims ratio measures freight damage and loss expense as a percentage of revenue: (Total Claims Paid + Claim Reserve) / (Total Revenue) x 100. Industry benchmark for dry van operations is 0.5 to 1.0 percent of revenue; specialized and high-value freight may target lower ratios. Claims ratio spikes indicate cargo securement issues, equipment problems, or handling process failures requiring investigation. Customer satisfaction score collected through post-delivery surveys measures the customer's holistic experience with the carrier including communication, driver professionalism, equipment condition, and billing accuracy. Leading fleets achieve scores of 4.5 or higher on five-point scales and respond systematically to any score below 4.0 with root cause analysis and corrective action.
QHow frequently should fleet KPIs be reviewed, and at what organizational levels?
Effective KPI governance distributes review frequency by metric type and organizational level. Driver-level performance metrics (fuel efficiency, idle time, safety events, on-time delivery) should be reviewed weekly by driver managers with individual driver scorecards shared directly with drivers. Vehicle-level maintenance metrics (PM compliance, MTBF, repair cost by asset) should be reviewed monthly by maintenance supervisors with exception reports highlighting out-of-tolerance assets. Operational KPIs (utilization rate, empty miles, dwell time) should be reviewed weekly by operations managers with daily exception monitoring for acute issues. Financial KPIs (cost per mile, fuel cost per mile, maintenance cost per mile) should be reviewed monthly by fleet managers with quarterly trend analysis for strategic planning. Customer service KPIs (on-time percentage, claims ratio) should be reviewed weekly by customer service managers with real-time alerting for specific load failures. Executive review of all KPI categories should occur monthly with focus on 12-month trends and leading indicator movement rather than point-in-time measurements.
QWhat are the leading indicators that should be tracked alongside lagging KPI measures?
Lagging KPIs measure results after they occur (cost per mile for the previous month, MTBF for the previous quarter). Leading indicators predict future KPI performance and enable proactive intervention. Key leading indicators for fleet management include: preventive maintenance scheduling adherence (predicts future MTBF and roadside breakdown frequency); driver hour utilization trend (predicts future on-time delivery percentage); fuel price purchase timing relative to market (predicts future fuel cost per mile); warranty claim submission timeliness (predicts future warranty recovery rate); driver turnover trend from new hire classes (predicts future driver retention and safety performance); parts inventory stockout frequency (predicts future mean time to repair and vehicle availability). Fleets that track both lagging KPIs and their leading indicators can intervene before KPI deterioration occurs rather than measuring decline after the fact. FleetRabbit's analytics suite includes configurable leading indicator monitoring with predictive alerts when early-warning metrics cross threshold values.
QHow should fleets establish realistic KPI targets when industry benchmarks may not reflect their specific operating environment?
Industry benchmarks provide directional guidance but do not replace fleet-specific target setting based on operational reality. Fleets should establish KPI targets using a three-step method: first, calculate historical performance for each KPI over the prior 12 to 24 months to establish baseline range and seasonal patterns. Second, segment historical performance by relevant dimensions — vehicle class and age, route type and geography, driver tenure and experience level, customer and freight type — to identify performance variation within the fleet. Third, set specific targets for each segment based on the 60th to 70th percentile of observed performance for metrics where improvement is possible, or external benchmarks for metrics where industry data is representative. Fuel efficiency targets should be adjusted for route topography (mountain routes reduce MPG by 15-25 percent compared to flat terrain), average load weight, and seasonal temperature effects. Maintenance cost per mile targets must account for vehicle age distribution, operating environment (construction versus linehaul versus local delivery), and component specification levels. Customer on-time targets should reflect customer-specific delivery window definitions and facility loading efficiency rather than assuming uniform 95 percent target. FleetRabbit's analytics includes historical baseline calculation, performance segmentation, and target recommendation based on fleet-specific historical data rather than generic benchmarks.
QWhat technology infrastructure is required to track these KPIs accurately and consistently?
Accurate KPI tracking requires integrated operational systems that capture data at source and feed consistent, structured data to analytics and reporting platforms. Essential technology components include: telematics or GPS tracking providing odometer readings, geolocation timestamps, engine hours, idle time, and hard braking events for every vehicle; electronic logging device (ELD) compliance data providing driver duty status and hours-of-service records; fuel card or fuel management system capturing gallons purchased, price per gallon, and vehicle assignment at transaction level; maintenance management system with work order cost tracking, parts inventory, and PM scheduling; dispatch and route management system capturing load assignment, planned versus actual route performance, and customer delivery windows. Optional but valuable components include driver mobile application for proof of delivery capture and customer satisfaction collection; electronic invoice and billing system for claims tracking and tender acceptance monitoring; and integrated analytics platform that consolidates data from all source systems without manual data manipulation. FleetRabbit provides the integrated fleet management platform that incorporates all essential KPI data sources — telematics integration, maintenance management, ELD data consolidation, fuel tracking, and dispatch workflow in a single system with built-in KPI dashboards and reporting.
QHow do KPI targets differ between fleet segments including truckload, less-than-truckload, last-mile delivery, and private fleet operations?
KPI prioritization and target ranges vary significantly by fleet segment based on different operating models and success factors. Truckload carriers prioritize cost per mile, empty miles percentage, and driver retention — with target cost per mile between 1.40 and 1.70 depending on length of haul and freight type. Less-than-truckload (LTL) carriers measure cost per hundredweight rather than per mile, prioritize on-time service percentage (target 95-98 percent), and track claims ratio (target below 1 percent) more aggressively than truckload due to higher customer touch frequency. Last-mile delivery and parcel fleets measure cost per stop, stops per hour (target 8-15 per hour depending on density), and delivery window compliance (target 95 percent or higher) — with utilization measured by hours of revenue service rather than miles. Private fleets (carriers operating their own trucks for their own freight) prioritize total delivered cost per unit compared to third-party carrier alternatives, on-time percentage to internal customers, and asset utilization to justify fleet ownership. Construction and vocational fleets measure cost per operating hour rather than per mile, prioritize equipment availability (target 90 percent or higher uptime), and track utilization by revenue-producing hours per day. Government and municipal fleets measure cost per vehicle per day, preventive maintenance compliance (target 90 percent or higher), and mean time between failures as primary efficiency indicators. Fleet managers should benchmark against same-segment operators rather than fleet averages to set appropriate targets.