Ask ten fleet managers how they built this year's budget and at least seven will admit the same thing: they started with last year's number and added a percentage for inflation. That approach works fine until fuel spikes, a tire supplier raises prices, or insurance renews at a rate nobody planned for, and suddenly the whole year is spent chasing a budget that never matched reality.
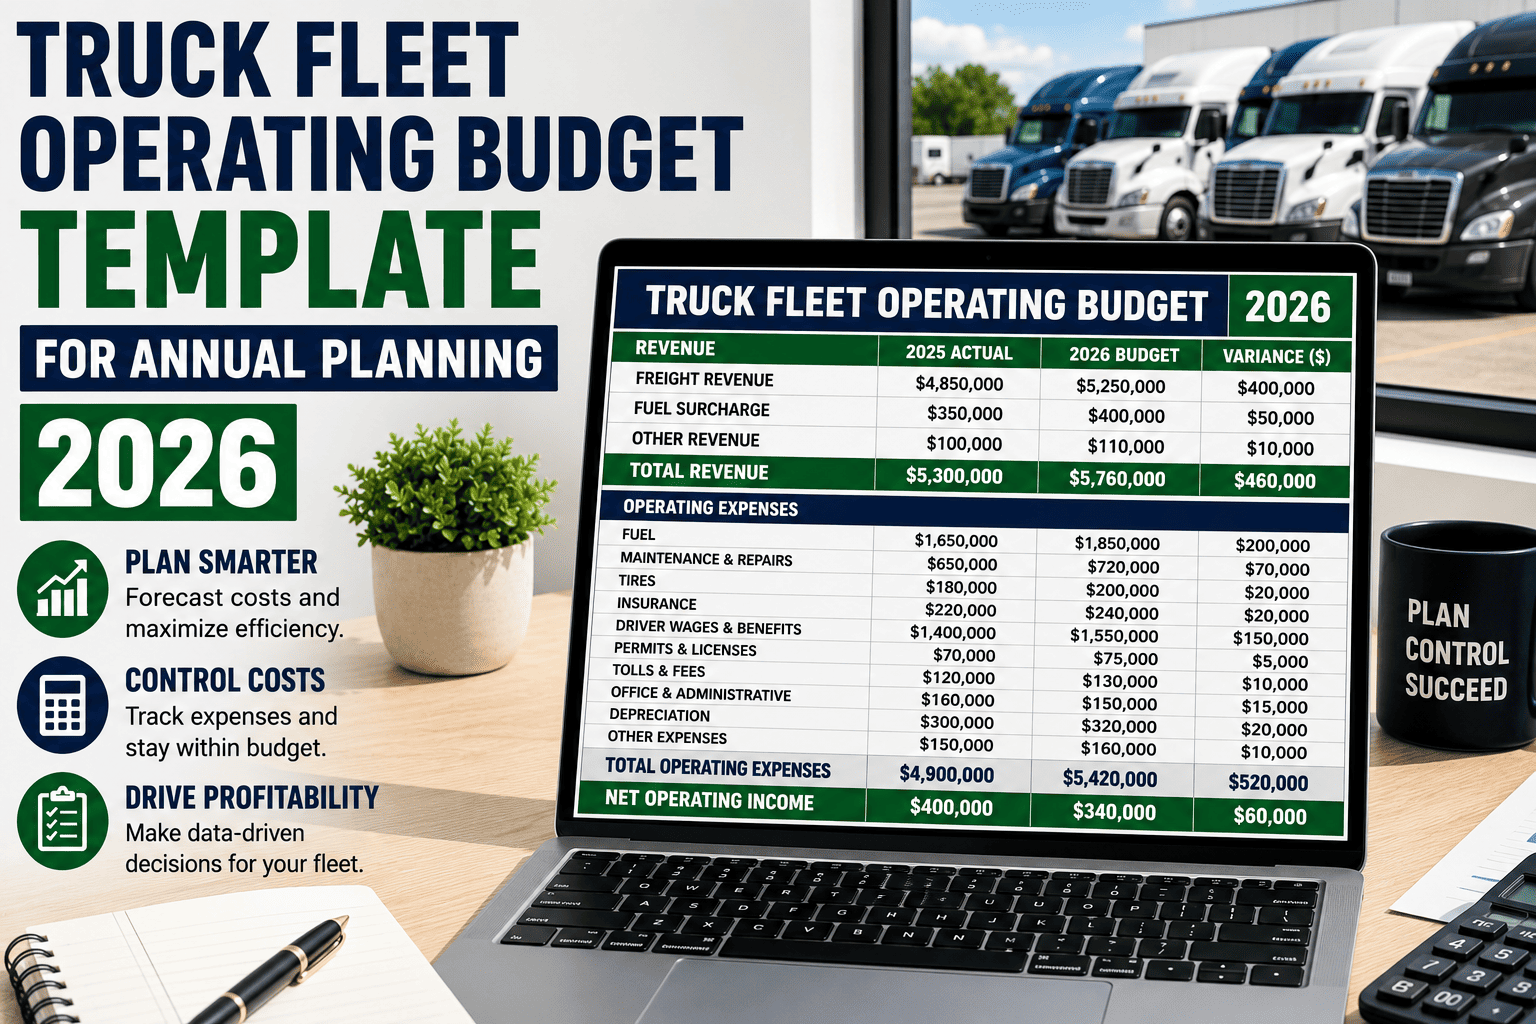
A truck fleet operating budget template built line by line, category by category, is the difference between reacting to costs and controlling them. This guide walks through exactly what belongs in a 2026 fleet budget, how the major cost categories typically break down, and how a platform like FleetRabbit turns that budget into a living document instead of a spreadsheet you revisit once a year.
Total trucking operating costs have been running above two dollars per mile industry-wide, with fuel, driver labor, maintenance, and insurance together making up the large majority of every operating dollar. Fleets that budget by category instead of a single lump sum catch cost overruns months earlier and protect margins that a flat annual estimate simply cannot see.
What Actually Goes Into a Truck Fleet Operating Budget
An operating budget is different from a purchase budget. It is not about what a truck costs to buy, it is about what it costs to keep on the road every single day: fuel, labor, maintenance, insurance, tires, permits, tolls, and the software that helps you track all of it. Missing even one category doesn't just create a small gap, it compounds across every truck in the fleet and shows up as a shortfall by the third quarter.
The Cost Categories Behind Every Mile
Below is a general view of how a typical operating dollar splits across major cost categories for a commercial truck fleet. Your exact mix will shift based on fleet size, routes, and equipment age, but this gives you a realistic starting proportion for your budget worksheet.
Approximate share of a fleet's total operating dollar across major cost categories. "Other" includes permits, tolls, software, and administrative overhead.
Line-by-Line Budget Template by Cost Category
Use this as your starting worksheet structure. Enter your fleet's actual figures per truck, then multiply across your total unit count to build the annual total.
| Budget Line | Typical Range | Fixed or Variable | Planning Notes |
|---|---|---|---|
| Fuel | $0.40 to $0.65 per mile | Variable | Track separately from surcharge recovery to see your true net spend |
| Driver Labor | $0.49 to $0.83 per mile | Variable | Include base pay, benefits, payroll taxes, and incentive pay, not just wages |
| Maintenance & Repairs | $0.08 to $0.22 per mile | Variable | Budget higher for trucks over seven years old; younger units run near the low end |
| Insurance | $150 to $900+ per vehicle monthly | Fixed | Renewal increases have outpaced most other categories; budget for upward movement |
| Tires | $0.02 to $0.06 per mile | Variable | Retreading reduces cost significantly versus new tire replacement on trailers |
| Permits, Tolls & Licensing | $0.02 to $0.05 per mile | Fixed | Often forgotten in quick estimates; small per mile but adds up fleet-wide |
| Software & Technology | $15 to $50 per vehicle monthly | Fixed | Telematics and maintenance platforms typically pay for themselves through fuel and downtime savings |
A note on idle time
An idling truck still burns fuel without generating revenue, and that hidden line item rarely makes it into a first-draft budget. Building in a small allowance for idle fuel loss keeps your fuel category from quietly running over every quarter.
FleetRabbit pulls real fuel, maintenance, and mileage data from your fleet so your budget stays accurate all year instead of going stale after January. You can sign up for a free trial and see your actual cost breakdown in minutes, or book a demo to walk through your specific fleet numbers with our team.
Fixed Costs vs Variable Costs: Structuring Your Budget
Separating fixed and variable costs is what turns a budget from a guess into a planning tool. Fixed costs stay steady regardless of how many miles you run, while variable costs move directly with fleet activity. Your annual plan needs both tracked separately, because a spike in one category can hide inside a lump-sum total for months before anyone notices.
Fixed Costs
Insurance premiums, lease or loan payments, licensing fees, and software subscriptions fall here. These costs arrive whether a truck runs 500 miles or 5,000 miles in a month, so they should be budgeted as flat monthly or annual figures per vehicle.
Variable Costs
Fuel, driver pay tied to mileage, maintenance and repairs, and tire wear scale with usage. These should be budgeted per mile or per engine hour, then multiplied by projected utilization for each vehicle class in your fleet.
Why This Split Matters at Renewal Time
When fixed and variable costs are tracked separately, a fleet manager can immediately see whether a budget overrun came from higher usage, which is often a good sign of business growth, or from rising per-unit costs, which signals a real problem to investigate. Lumping everything together hides that distinction until the annual review, by which point the damage is already done.
Building Your Annual Budget in 5 Steps
Start with real spend by category, not estimates. If your records are scattered across invoices and spreadsheets, this step alone often reveals categories you underestimated last year.
Estimate expected miles or hours per vehicle for the coming year based on contracts, seasonal demand, and route changes.
Multiply variable cost categories by projected mileage, then add fixed costs per vehicle to build a per-truck annual total.
Add a reasonable buffer, often 5 to 10 percent, to absorb fuel volatility, insurance renewal surprises, and unplanned repairs.
Compare actuals against budget every quarter so variances get caught and corrected long before year-end.
Budgeting Mistakes That Quietly Drain Fleet Profits
Most fleet budgets don't fail because of one big error. They fail from small, repeated gaps that compound across every truck and every month.
A five-year-old truck and a brand-new truck do not cost the same to maintain. Budgeting them identically overstates the new truck's cost and understates the older one's, until the older truck's repair bills blow past what was planned.
Idling trucks burn fuel without adding revenue miles, and this loss rarely gets its own line item, which means the fuel budget quietly runs over every quarter without an obvious cause.
Insurance renewals, sudden fuel spikes, and unplanned repairs happen every year. A budget with zero buffer for volatility is a budget that will be wrong by design.
By the time an annual review catches a cost overrun, three-quarters of the year's damage is already done. Quarterly check-ins catch problems while there is still time to correct course.
FleetRabbit tracks fuel, maintenance, and utilization by vehicle so you can compare actuals to budget any day of the year, not just at renewal. Sign up free to connect your fleet data today, or book a 30-minute demo and we'll show you where your current budget has the biggest gaps.
A budget built on real data instead of last year's guess is the fastest way to protect your margins in 2026. FleetRabbit connects fuel, maintenance, and mileage tracking into one place so your numbers stay accurate all year long. Get started free, no credit card required, or talk to our team first.







