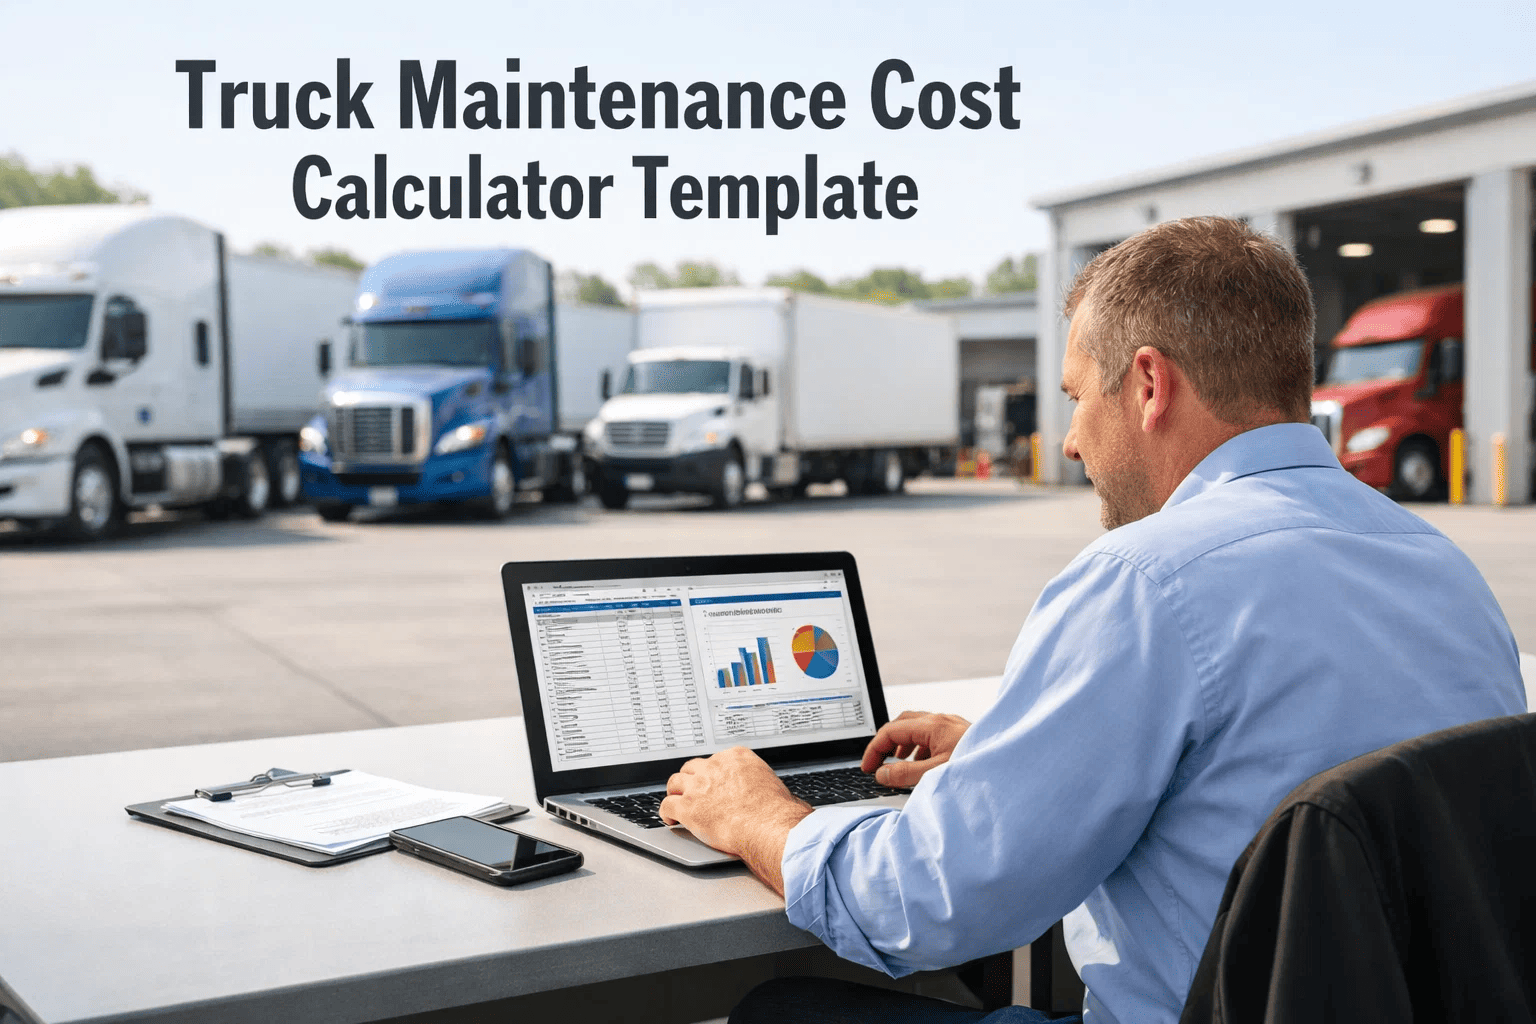
Fleet maintenance cost in commercial trucking is simultaneously one of the largest operating cost categories and one of the most poorly understood at the vehicle level. Total maintenance expenditure is visible in accounting systems — parts purchases, shop labor invoices, outside repair bills, and tire accounts. What is typically invisible to fleet managers and CFOs without dedicated cost analytics is the distribution of that expenditure across the vehicle population — which vehicles are consuming three times the fleet average in maintenance cost per mile, whether that overconsumption is driven by vehicle age, operating conditions, driver behavior, deferred PM, or equipment specification, and whether the remediation strategy should be accelerated trade or PM program intensification. Fleet maintenance cost calculators and tracking frameworks give operations management the analytical infrastructure to answer those questions with data rather than judgment — and to present the answers to ownership and finance stakeholders in the financial terms that drive investment decisions about fleet replacement cycles, PM program funding, and driver coaching initiatives. This resources guide covers the structure of an effective fleet maintenance cost tracking framework, the cost categories that must be captured at the vehicle level to produce actionable analysis, how FleetRabbit's work order management and reporting module provides the data collection infrastructure that turns a cost calculator template into a live operational intelligence tool, and how to build the executive maintenance cost reporting that VP of Operations and CFO stakeholders need to make fleet investment decisions based on total cost of ownership rather than acquisition price alone. Book a demo to see how FleetRabbit tracks fleet maintenance cost per vehicle with automated reporting for operations executives.
$0.18
average maintenance cost per mile for Class 8 tractors at industry norm — high-cost units frequently exceed $0.35 per mile without active cost management
3x
typical ratio between lowest and highest maintenance cost per mile within the same fleet operating the same equipment — driven by driver behavior, deferred PM, and operating conditions
42%
of fleet maintenance budget consumed by the highest-cost 20% of vehicles in fleets without active maintenance cost tracking and vehicle-level intervention programs
$185K
estimated annual maintenance cost reduction for a 100-unit fleet that moves from reactive to planned maintenance — assuming industry baseline improvement rates
Free Resource
Fleet Maintenance Cost Tracking Framework
This guide covers the complete cost tracking framework, calculation methodology, and reporting structure for fleet maintenance cost management. Use it directly or as the design basis for configuring FleetRabbit's cost reporting for your fleet.
The Seven Cost Categories That Must Be Tracked at the Vehicle Level
A maintenance cost framework that tracks only the costs that are easiest to record — typically parts purchases and outside repair invoices — will produce an incomplete picture that systematically misattributes cost to categories where the accounting is cleaner rather than where the economic impact is greatest. The following seven cost categories represent the complete set of maintenance-related expenditures that must be tracked at the vehicle level to produce the cost-per-mile and cost-per-unit analysis that drives actionable fleet management decisions.
01
Planned Preventive Maintenance
Labor and parts cost for oil and filter changes, brake adjustments, lubrication services, tire rotation and replacement on schedule, and all other maintenance activities performed at defined mileage or calendar intervals. This is the most controllable cost category and the baseline from which all other categories represent deviation or additional expense.
Calculation: Sum of work order cost for all PM-coded work orders per vehicle per period. Cost per mile: total PM cost divided by miles operated in the same period.
02
Unplanned Corrective Repair
Labor and parts cost for repairs initiated in response to breakdown, driver defect report, or roadside inspection defect — as distinguished from PM-triggered maintenance. The ratio of unplanned to planned maintenance cost per vehicle is one of the highest-value diagnostic metrics in fleet cost analysis, indicating which vehicles and which operating contexts are generating disproportionate breakdown maintenance activity.
Calculation: Sum of work order cost for all corrective-coded work orders. Planned-to-unplanned ratio: PM cost divided by total work order cost — target above 65% planned for a well-managed fleet.
03
Tire Cost
Tire purchase, mounting, balancing, and disposal cost tracked separately from other parts categories due to the magnitude of the expense and the strong correlation between tire cost per mile and driver behavior — specifically, harsh braking, aggressive acceleration, and high-speed operation, each of which measurably accelerates tire wear. Tire cost per mile comparison across drivers operating the same route type is one of the clearest indicators of driving behavior cost impact.
Calculation: Total tire expense per vehicle per period including all related labor. Cost per mile and cost per tire life compared against fleet benchmark to identify outliers for driver coaching review.
04
Outside Repair and Roadside Emergency
Cost of repairs performed by outside vendors — dealer service, roadside assistance, and third-party repair facilities — at typically premium rates compared to in-house shop labor. High outside repair expenditure per vehicle indicates either an in-house capability gap for specific repair categories or a vehicle with breakdown patterns that require roadside intervention rather than planned shop visits. Premium emergency service rates should always be tracked separately from planned outside vendor work.
Calculation: Outside repair invoices assigned to vehicle record in FleetRabbit work orders. Premium cost premium: calculate average outside repair cost versus in-house equivalent labor rate for same repair types.
05
Downtime Cost
Revenue-equivalent cost of each day a vehicle is out of service for maintenance — representing the load revenue that cannot be generated while the truck is in the shop or awaiting repair. Downtime cost is the most consequential non-cash maintenance cost category and often the most overlooked. A vehicle with modest parts and labor cost but high downtime frequency may be the most expensive unit in the fleet when downtime cost is included in the total cost calculation.
Calculation: Work order open-to-close duration converted to revenue-equivalent days at average revenue per vehicle per day. FleetRabbit work order timestamps provide the duration data; fleet revenue averages provide the conversion factor.
06
Warranty Recovery Tracking
Cost of repairs performed on vehicles still under OEM warranty or extended service contract, which should generate a warranty recovery claim against the manufacturer or contract provider. Fleets without systematic warranty tracking consistently forfeit recoverable costs by failing to file claims for warranty-covered repairs — particularly in the first 12 to 24 months of vehicle operation when OEM component warranties are most active and the claim filing opportunity is highest per unit.
Calculation: Work orders coded as warranty-eligible with claim tracking in FleetRabbit. Recovery rate: warranty cost recovered as a percentage of warranty-eligible repair cost. Target above 90% recovery rate.
07
Driver Damage and Accident-Related Repair
Repair cost attributable to driver-caused damage — backing damage, dock accidents, minor collisions, and equipment misuse — tracked separately from mechanical failure maintenance to support driver accountability assessment and insurance claim management. Some fleets implement driver damage chargeback programs that create personal financial accountability for preventable damage, which requires accurate per-driver damage cost tracking as the financial basis for the program.
Calculation: Work orders coded as driver damage with driver attribution in FleetRabbit. Driver damage cost per driver compared against fleet average to identify patterns requiring coaching or disciplinary intervention.
Cost-Per-Mile Calculation Methodology and Fleet Benchmark Framework
Cost per mile is the universal normalized metric for fleet maintenance cost comparison because it controls for the obvious variable that makes simple cost comparison meaningless: vehicles that operate more miles accumulate more maintenance-related expenditure, and a high-mileage vehicle with high total maintenance cost may actually be more cost-efficient than a low-mileage vehicle with a fraction of the total cost when both are expressed as cost per mile. The calculation is straightforward, but the data discipline required to produce accurate cost-per-mile figures at the vehicle level — with every work order assigned to the correct vehicle, all cost categories captured, and odometer readings tracked consistently — requires the integrated data collection infrastructure that FleetRabbit provides.
Vehicle-Level Cost Per Mile Calculation Framework
| Cost Metric |
Calculation Formula |
Industry Benchmark (Class 8) |
Action if Above Benchmark |
| Total Maintenance Cost Per Mile |
Total WO cost / Miles operated in period |
$0.15 to $0.22 per mile depending on age and spec |
Review vehicle for accelerated trade decision versus targeted PM investment |
| Unplanned Repair Cost Per Mile |
Unplanned WO cost / Miles operated in period |
Below $0.06 per mile in well-managed fleets |
Investigate root cause — deferred PM, driver behavior, or component wear acceleration |
| Tire Cost Per Mile |
Total tire expense / Miles operated in period |
$0.03 to $0.05 per mile for typical long-haul operations |
Review assigned driver's telematics — harsh braking and aggressive acceleration indicate driver-caused wear acceleration |
| Downtime Days Per 100,000 Miles |
(Total repair days × 100,000) / Miles operated |
Below 3 days per 100,000 miles for planned maintenance; below 1.5 for unplanned |
Assess PM compliance and parts availability — high downtime often indicates PM deferral or parts stockout during repair |
| Planned Maintenance Ratio |
PM WO cost / Total WO cost |
Target above 65% — high-performing fleets achieve 75% or higher |
Review PM schedule compliance — low planned ratio indicates PM deferral that is producing higher unplanned repair cost |
| Outside Repair Premium |
Outside repair spend / Total repair spend |
Below 20% — higher ratios may indicate in-house capability gap or roadside breakdown frequency issue |
Assess whether in-house technician capability, parts availability, or vehicle condition is driving outside repair frequency |
| Warranty Recovery Rate |
Warranty cost recovered / Warranty-eligible repair cost |
Target above 90% for fleets with active warranty management programs |
Audit warranty claim filing process — identify unclaimed eligible repairs from prior periods within the claim filing window |
How FleetRabbit Replaces the Spreadsheet Maintenance Cost Tracker
A spreadsheet-based fleet maintenance cost tracker can produce accurate cost analysis — but only if the person maintaining it is disciplined enough to enter every work order cost, every parts expenditure, and every outside repair invoice into the correct row for the correct vehicle with the correct cost category coding, every time, without gaps or delays. In practice, spreadsheet-based maintenance cost tracking produces accurate data for the periods when maintenance administrators have time to maintain it diligently and increasingly inaccurate data during periods of high operational tempo when the demand on that same administrator's time is greatest — which is precisely when the maintenance cost anomalies that would be most valuable to detect are most likely to be occurring.
FleetRabbit replaces the spreadsheet maintenance tracker by capturing cost data as a byproduct of the work order creation and completion process that the shop team already performs for every maintenance event. When a technician creates a work order in FleetRabbit and records the parts used and labor hours consumed, those cost elements are automatically attributed to the vehicle record and included in the vehicle's running cost calculation — without any separate data entry step by a maintenance administrator. The cost data is always current, always at the vehicle level, and always available for the reporting and analysis that fleet managers and finance stakeholders need.
FleetRabbit vs Spreadsheet: Cost Tracking Capability Comparison
Real-Time Cost Update After Work Order Completion
Requires manual data entry after each work order — delays of hours to days typical
Automatic at work order close — vehicle cost record updated immediately
Multi-Terminal Fleet-Wide Cost View
Requires separate spreadsheet per terminal or manual consolidation — error-prone and time-intensive
Single cost dashboard covering all terminals — updated in real time as work orders close at each location
Cost-Per-Mile Calculation
Manual calculation requiring odometer data from separate source — typically monthly at best
Automatic calculation using odometer readings captured at each PM service and DVIR — updated continuously
Cost Category Classification
Relies on administrator discipline to correctly classify each entry — inconsistency common over time
Work order type drives automatic cost category classification — PM, corrective, tire, warranty, and driver damage coded at work order creation
High-Cost Vehicle Identification
Requires sorting and filtering after export — analytical step separate from data collection
FleetRabbit dashboard ranks vehicles by cost-per-mile — highest-cost units visible in real time without additional analysis
Executive Cost Reporting
Manual report assembly required — typically requires 4 to 8 hours per monthly reporting cycle
Automated cost reports configurable for VP of Operations and CFO — scheduled delivery or on-demand access
Replace Your Maintenance Cost Spreadsheet With Live Fleet Data
FleetRabbit captures maintenance cost at the vehicle level automatically from work orders — giving fleet managers real-time cost-per-mile visibility without manual data entry or monthly reconciliation exercises.
Identifying the High-Cost Vehicles in Your Fleet
In virtually every trucking fleet for which vehicle-level maintenance cost analysis has been completed, the cost distribution follows a highly skewed pattern: a small proportion of vehicles — typically 15 to 25 percent — account for 40 to 55 percent of total fleet maintenance expenditure. These vehicles are the high-cost outliers whose maintenance burden is subsidized across the fleet when costs are managed as a fleet aggregate rather than tracked at the vehicle level. Identifying these vehicles and addressing their above-average cost is the highest-return activity in fleet maintenance cost management — because removing one high-cost outlier from the fleet through an accelerated trade decision or a targeted intervention (component replacement, driver reassignment, PM intensification) can reduce total fleet maintenance expenditure more than spreading PM improvements across the average-cost majority of the fleet.
High-Cost Vehicle Diagnostic Framework
Age and Mileage Profile
Is the vehicle's cost above benchmark because of accumulated age and mileage that makes it structurally more expensive to maintain?
Decision: Accelerated trade using FleetRabbit TCO analysis to determine economic trade trigger versus continued operation with intensified PM
Deferred PM History
Does the vehicle show PM overdue periods in FleetRabbit that correlate with subsequent corrective repair cost spikes — indicating that deferred maintenance is producing higher-than-necessary repair expenditure?
Decision: Restore PM compliance and evaluate whether the corrective repair cost trend reverses over the next 90 days before making a trade decision
Driver Assignment Pattern
Has the vehicle's above-average cost developed primarily during periods of assignment to a specific driver, while operating at close to average cost under other drivers?
Decision: Driver reassignment and coaching intervention rather than vehicle trade — the problem is behavioral, not mechanical
Specific Component Pattern
Is the above-average cost concentrated in a specific component category — for example, recurring injector or aftertreatment repair — that might indicate a specification or application mismatch?
Decision: Engineering review of vehicle specification versus operating application, potentially including route reassignment to better-matched duty cycle
Operating Condition Profile
Is the vehicle operated in conditions — extreme climate, mountainous terrain, urban stop-and-go — that legitimately produce higher maintenance cost than the fleet average operating profile?
Decision: Adjust the benchmark comparison for operating context before concluding the vehicle is a true outlier — context-adjusted benchmarks prevent valid operational necessity from appearing as cost management failure
Accident and Damage History
Does the vehicle carry above-average repair cost from accident-related or driver-damage-related work orders that should be attributed to insurance claims or driver accountability rather than maintenance budget?
Decision: Separate accident damage cost from maintenance cost in the vehicle record to produce accurate maintenance-only cost analysis and ensure correct cost attribution to insurance recovery and driver programs
Building the Executive Maintenance Cost Report
Fleet managers who produce effective executive maintenance cost reports for VP of Operations and CFO stakeholders consistently describe the same challenge: translating granular vehicle-level cost data into the business-impact terms that non-operations finance stakeholders can act upon. A report that presents 200 rows of vehicle cost-per-mile data to a CFO produces a spreadsheet review rather than a business decision. The executive maintenance cost report that drives investment decisions has five specific components that present the operational complexity as a financial narrative.
01
Fleet Maintenance Cost Trend
Total maintenance cost per month and rolling 12-month trend — showing whether the fleet's total maintenance burden is increasing, decreasing, or stable. This is the headline metric that tells the CFO whether the maintenance cost situation is improving or requiring intervention at a budget level. FleetRabbit generates this trend automatically from work order cost data without manual compilation.
02
Planned vs Unplanned Maintenance Ratio
The fleet-wide and terminal-level split between planned and unplanned maintenance cost expressed as a percentage — with trend versus prior period and explanation of significant ratio shifts. A declining planned ratio is an advance warning indicator of PM compliance deterioration that will produce higher unplanned costs in subsequent periods if not addressed.
03
High-Cost Vehicle Outlier Summary
A list of the 10 to 15 vehicles with the highest maintenance cost-per-mile variance above fleet average — with the specific cost category driving the variance, the vehicle's age and mileage, the recommended action (trade, PM intensification, driver reassignment, or component replacement), and the estimated cost impact of the recommended action over the next 12 months. This is the actionable section of the report that generates the CFO decision conversation about fleet investment.
04
PM Compliance Rate and Deferred Maintenance Value
Fleet-wide PM compliance rate — the percentage of PM due dates met within the configured tolerance window — with an estimate of the deferred maintenance value for vehicles currently overdue for scheduled service. The deferred maintenance value converts PM overdue status into a financial risk metric that executives understand: the expected cost of the failures that will result from continued deferral, based on historical correlation data from the fleet's own work order history.
05
Downtime Cost Summary
Total vehicle downtime days in the period converted to revenue-equivalent cost at the fleet's average revenue per truck per day — categorized by planned maintenance downtime (expected and controllable within PM efficiency bounds) versus unplanned breakdown downtime (avoidable and cost-improvable through PM program improvement). The downtime cost summary is frequently the section that produces the most significant executive response, because the revenue-equivalent cost of avoidable downtime often exceeds the direct parts and labor cost and makes the investment case for maintenance program improvement undeniable in financial terms.
Maintenance Cost Tracking Implementation Checklist
Phase 1: Data Infrastructure Setup (Weeks 1 to 2)
Establish vehicle records in FleetRabbit for every active unit — including unit number, make, model, engine, year, and current odometer reading
Configure work order types — PM, corrective, tire, warranty, accident damage — to enable automatic cost category classification from work order type field
Set cost rate values for all shop labor categories used in work orders — technician tier rates, flat rate times for standard repairs, outside vendor default rates
Import prior 12 months of historical work order cost data from prior system if available — to establish baseline cost-per-mile benchmarks from actual fleet history
Phase 2: Reporting Configuration (Weeks 2 to 3)
Configure fleet maintenance cost dashboard showing total cost, cost per mile, planned vs unplanned ratio, and top-10 high-cost vehicles by default view
Set cost alert thresholds for specific vehicles or vehicle categories — alert when cost per mile exceeds 150% of fleet average for any vehicle in a rolling 90-day period
Configure automated monthly executive report delivery schedule for VP of Operations and CFO recipients
Establish terminal-level cost reporting for terminal managers — showing their terminal's cost performance against fleet benchmark
Phase 3: Operational Integration (Month 2 Onward)
Brief service managers and shop foremen on work order cost entry requirements — labor hours, parts cost, and work order type classification are all required fields, not optional
Implement monthly fleet manager review of high-cost vehicle outlier list — assigning diagnostic investigation and recommended action for each outlier unit
Integrate cost-per-mile data into vehicle trade analysis — using FleetRabbit's lifetime maintenance cost data as a TCO input alongside depreciation and expected residual value
Review PM compliance rate monthly alongside cost trend — to verify that PM discipline improvements are producing the expected cost-per-mile improvement over the 90-day horizon
Frequently Asked Questions: Fleet Maintenance Cost Tracking
How does FleetRabbit handle maintenance cost tracking for leased vehicles versus owned vehicles?
FleetRabbit tracks maintenance cost at the vehicle level regardless of ownership structure. For leased vehicles operating under fleet maintenance lease structures that include bundled maintenance, the work order system can be configured to flag maintenance costs as lease-covered versus fleet-responsibility, enabling accurate cost attribution to the correct budget line. For vehicles under operating leases with fleet-responsible maintenance, cost per mile data is particularly valuable for monitoring whether the vehicle's actual maintenance experience is aligning with the cost assumptions in the lease underwriting — which affects the economic analysis of lease renewal versus replacement decisions.
What is the minimum period of data needed to produce meaningful cost-per-mile benchmarks from FleetRabbit work order history?
Ninety days of complete work order history provides sufficient data for initial cost-per-mile benchmarks, but the benchmark confidence improves significantly at 12 months of data due to the seasonal variation in maintenance cost that 90-day snapshots can miss. Winter months consistently produce higher corrective repair cost in cold-climate operations due to weather-related component failures, and summer months produce higher cooling system maintenance costs in high-temperature markets. Twelve months of data captures these seasonal variations and produces a full-year benchmark that is a more reliable baseline for identifying year-round outlier vehicles than a 90-day snapshot that may coincide with an atypical maintenance period.
How should fleet managers differentiate between a vehicle that is a true cost outlier and one that appears high-cost due to operating in a more demanding environment?
FleetRabbit's vehicle segmentation capabilities support cost comparison within peer groups defined by operating context — for example, comparing urban delivery vehicles against each other and long-haul vehicles against their own peer group rather than against a mixed-fleet average. Within a peer group defined by route type, climate exposure, and load profile, the legitimate high-cost outliers are more clearly visible because the environmental baseline is controlled. Vehicles that appear high-cost in a fleet-wide comparison but are average or below-average within their peer group are not true outliers — they are correctly capturing the cost of their operating environment. Vehicles that are above their peer group average, even after controlling for operating context, are the candidates for the diagnostic framework and intervention analysis.
Can FleetRabbit's maintenance cost data be integrated with the company's ERP or accounting system for GL account posting?
FleetRabbit supports data export in standard formats that can be used to populate ERP systems with maintenance cost data at the vehicle level, work order type level, and GL account code level for financial reporting integration. For companies using QuickBooks, SAP, or similar accounting systems, maintenance cost data from FleetRabbit work orders can be periodically exported and imported to the accounting system to maintain vehicle-level cost allocation in the financial records. Direct API integration for real-time ERP posting is available for enterprise deployments where the technical integration investment is warranted by the transaction volume and reporting requirement.
Every Dollar You Cannot Track Is a Dollar You Cannot Manage
Fleet maintenance cost management begins with vehicle-level cost visibility — which requires the integrated work order management, PM tracking, and cost analytics infrastructure that FleetRabbit provides. When every maintenance dollar is captured in real time at the vehicle level, fleet managers can identify the outliers, diagnose the causes, implement the interventions, and measure the cost impact of every decision. That is the difference between managing a fleet by budget and managing a fleet by data.
Maintenance Cost Tracking
Cost Per Mile Analytics
Fleet Work Orders
Executive Cost Reporting
PM Compliance
Total Cost of Ownership
April 18, 2026
By Jason Smith
All Posts