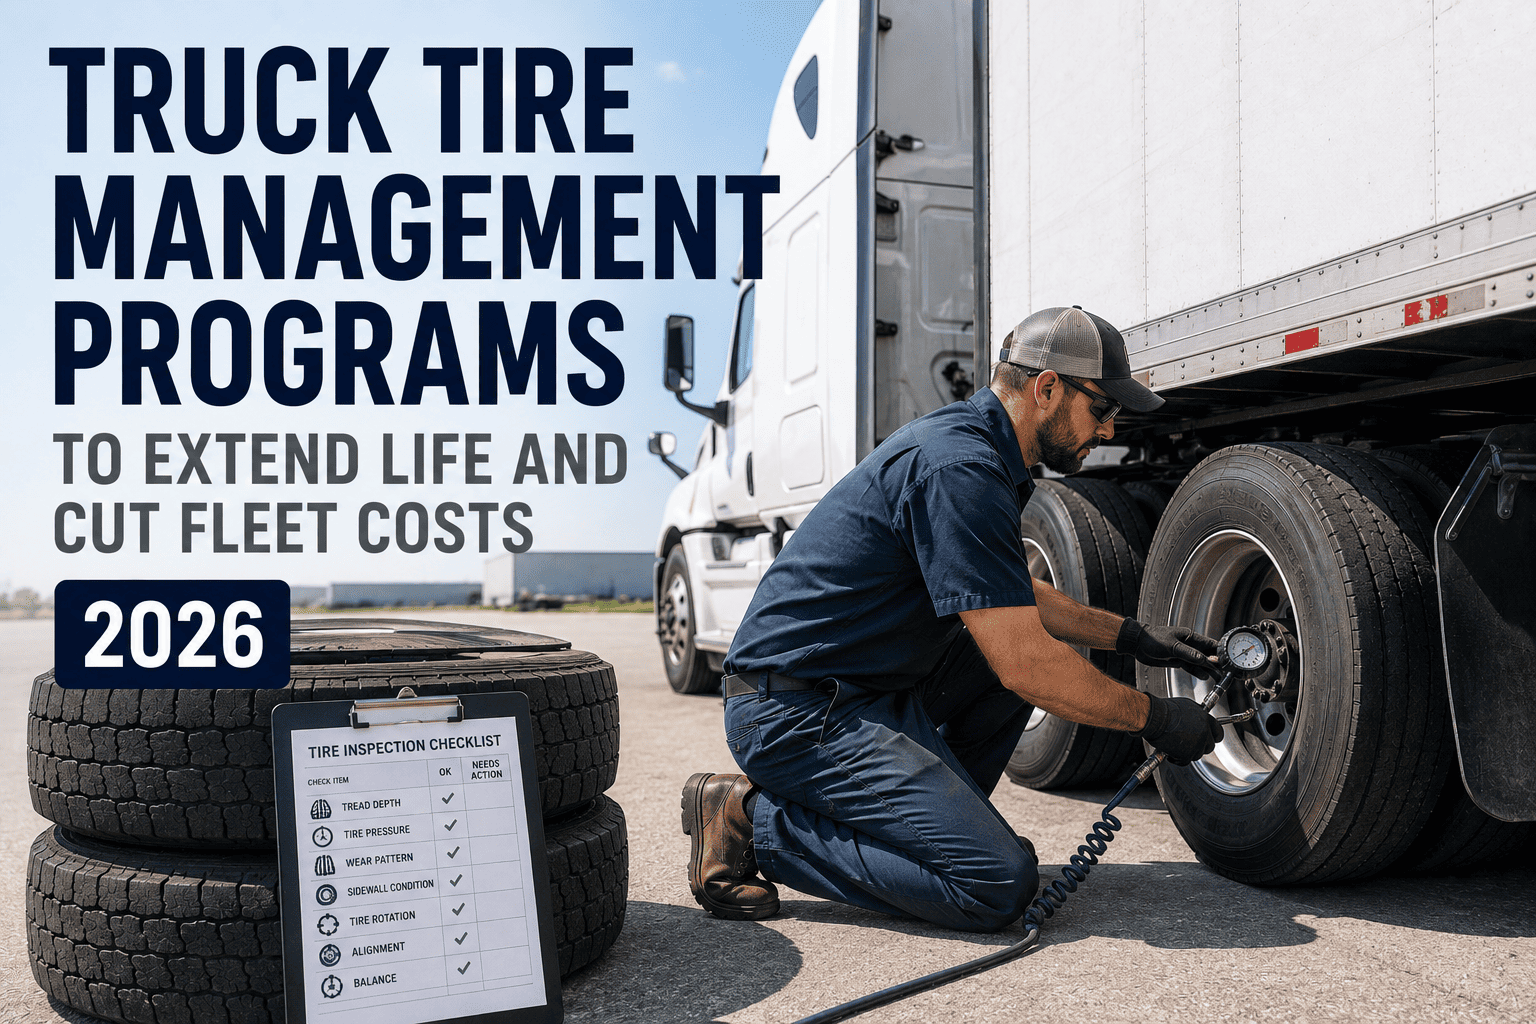
Tires are the second or third highest line item on most trucking fleet budgets, right behind fuel, and yet they are usually the most reactively managed cost a fleet carries. A driver notices a tire looks low. A technician eyeballs tread during a scheduled service. Nobody is tracking the slow ten-PSI drop that has been quietly eating fuel economy and tire life for three weeks. A structured tire management program closes that gap, and the fleets that build one consistently cut total tire spend by 25 to 40 percent without changing a single tire brand.
Why Tires Quietly Become Such an Expensive Problem
A 100-truck fleet spending 450,000 dollars a year on tires is not an unusual number, and that figure does not even include the cascading costs underneath it: fuel waste from underinflation, roadside service calls, lost retread value, and the CSA violations that come from tires nobody caught during a pre-trip walk-around. Tire-related issues consistently rank as the second-highest vehicle out-of-service violation category in roadside inspections, behind only brakes.
Reading Wear Patterns Like a Diagnostic Tool
A worn tire is not a mystery. The shape of the wear pattern points directly back to whatever caused it, and technicians who learn to read these patterns catch the root problem before it destroys the next tire too.
Center Wear
Almost always signals overinflation, with the tire's center contacting the road more than the shoulders and wearing down faster as a result.
Edge Wear
The opposite problem, underinflation, where the shoulders carry more load than they were designed for while the center rides high.
Feathering
A telltale sign of toe misalignment, where the tread edges develop a sharp, angled pattern from the tire being dragged slightly sideways with every rotation.
Cupping or Scalloping
Usually points to a suspension issue, often a worn shock or strut, causing the tire to bounce unevenly across the road surface.
Why Rotation Alone Never Fixes the Problem
Rotating a tire showing one of these wear patterns without first correcting the underlying inflation, alignment, or suspension issue just relocates the damage. The pattern returns, now wearing down a different tire instead. Diagnosing the root cause before rotating is what actually protects the investment rather than just moving it around the truck.
The Five Disciplines That Actually Control Tire Cost
Every effective tire program comes down to the same five fundamentals, executed consistently rather than occasionally. Skipping any one of them quietly undermines the other four.
| Discipline | What It Protects | Cost of Skipping It |
|---|---|---|
| Inflation Management | Tire life and fuel economy together | 15% tire life and 2% fuel economy lost per 10 PSI below spec |
| Rotation Scheduling | Even wear across all axle positions | Up to 25% premature replacement from position-specific wear |
| Alignment Checks | Tread life and suspension components | Up to 12,000 miles lost per tire set, plus accelerated suspension wear |
| Tread Depth Tracking | Safety margin and retread eligibility | Casings scrapped instead of retreaded, losing 200 to 280 dollars per lost retread life |
Inflation Is the Single Highest-Leverage Habit
Of the five disciplines, inflation management delivers the most return for the least effort. A calibrated gauge and sixty seconds per tire is the entire task, yet most fleets relying on manual checks alone still run a meaningful share of their tires below the five PSI tolerance that actually matters, simply because weekly gauge checks are easy to skip when a yard gets busy.
What a Slow Leak Actually Costs Over a Month
A tire losing pressure slowly does not announce itself. It just quietly costs fuel economy and tread life every single day until someone happens to check it. Across a fleet running dozens of trucks, that invisible leak adds up to thousands of dollars in wasted fuel annually before a single tire even needs early replacement, which is exactly the kind of slow bleed that continuous pressure monitoring is built to catch.
What to Look for in a Tire Management Platform
A clipboard can record a pressure reading once. It cannot trend that reading against the last ten checks, flag a slow leak before it becomes a blowout, or tell a fleet manager which specific axle position is chronically wearing fast across the entire fleet.
Continuous Pressure Monitoring
Catching a slow leak between scheduled inspections instead of waiting for the next pre-trip check to discover it.
Tread Depth Tracked by Position
Recording depth per axle position over time, not just at replacement, to catch a wear pattern before it ruins a casing's retread value.
Mileage-Triggered Rotation Alerts
Rotation reminders tied to actual odometer data rather than an estimated calendar interval that drifts out of sync with real usage.
Retread Eligibility Tracking
Flagging a casing for retread before it gets scrapped past the point of eligibility, since most lost retread value comes from simply not tracking casing condition.
The fastest way to see how much of this gap exists in your own fleet is to put real tire data into a system built for it. You can sign up for a free trial and start tracking pressure and tread depth across your fleet within a day.
How FleetRabbit Manages Tires as a Tracked Asset
FleetRabbit treats every tire as its own asset, mounted to a specific vehicle and axle position, with a complete history that follows it from installation through rotation, repair, and eventual retread or disposal.
Pressure and Tread Trends, Not Just a Snapshot
Every reading is logged against the same tire's history, so a slow pressure drop or an accelerating wear pattern shows up as a trend line long before it becomes a roadside breakdown.
Rotation and Alignment Tied to Real Mileage
Rotation work orders fire based on actual telematics odometer data, and alignment checks get flagged automatically when a wear pattern across positions points to a developing alignment problem.
Casing Value Protected Through Retread Tracking
FleetRabbit flags casings approaching retread eligibility thresholds before they are scrapped, so the choice between a low-cost retread and a full-price replacement is made with data instead of a quick visual guess.
Stop Treating Tires as an Unpredictable Expense
FleetRabbit tracks pressure, tread depth, rotation history, and retread eligibility for every tire on every truck, turning your tire program from reactive guesswork into a managed, predictable cost. Sign up for a free trial and load your fleet's tire data today, or book a demo to see your specific tire program modeled on the call.
What a Real Tire Program Is Worth on Paper
For a 100-truck fleet spending roughly 450,000 dollars annually on tires, moving from reactive to structured tire management typically delivers somewhere between 112,500 and 180,000 dollars in annual savings, drawn from extended tire life, reduced fuel waste, fewer roadside breakdowns, and better retread recovery working together rather than any single fix alone.
Most of the Savings Compound
None of these five disciplines work in isolation. Better inflation discipline improves fuel economy and extends tread life at the same time. Catching alignment issues early protects both the tire and the suspension components around it. The math is not one large win, it is several smaller, compounding wins that together account for why a structured program outperforms any single tire-cost initiative on its own.
Frequently Asked Questions
Your Tires Are Already Telling You What's Wrong
The wear pattern, the slow pressure drop, the casing that should have gone to retread, all of it is visible data waiting to be tracked. FleetRabbit turns that data into a structured program that extends tire life and protects your budget instead of reacting to the next roadside breakdown. Get started with a free trial or talk through your specific fleet and tire spend with our team first.







