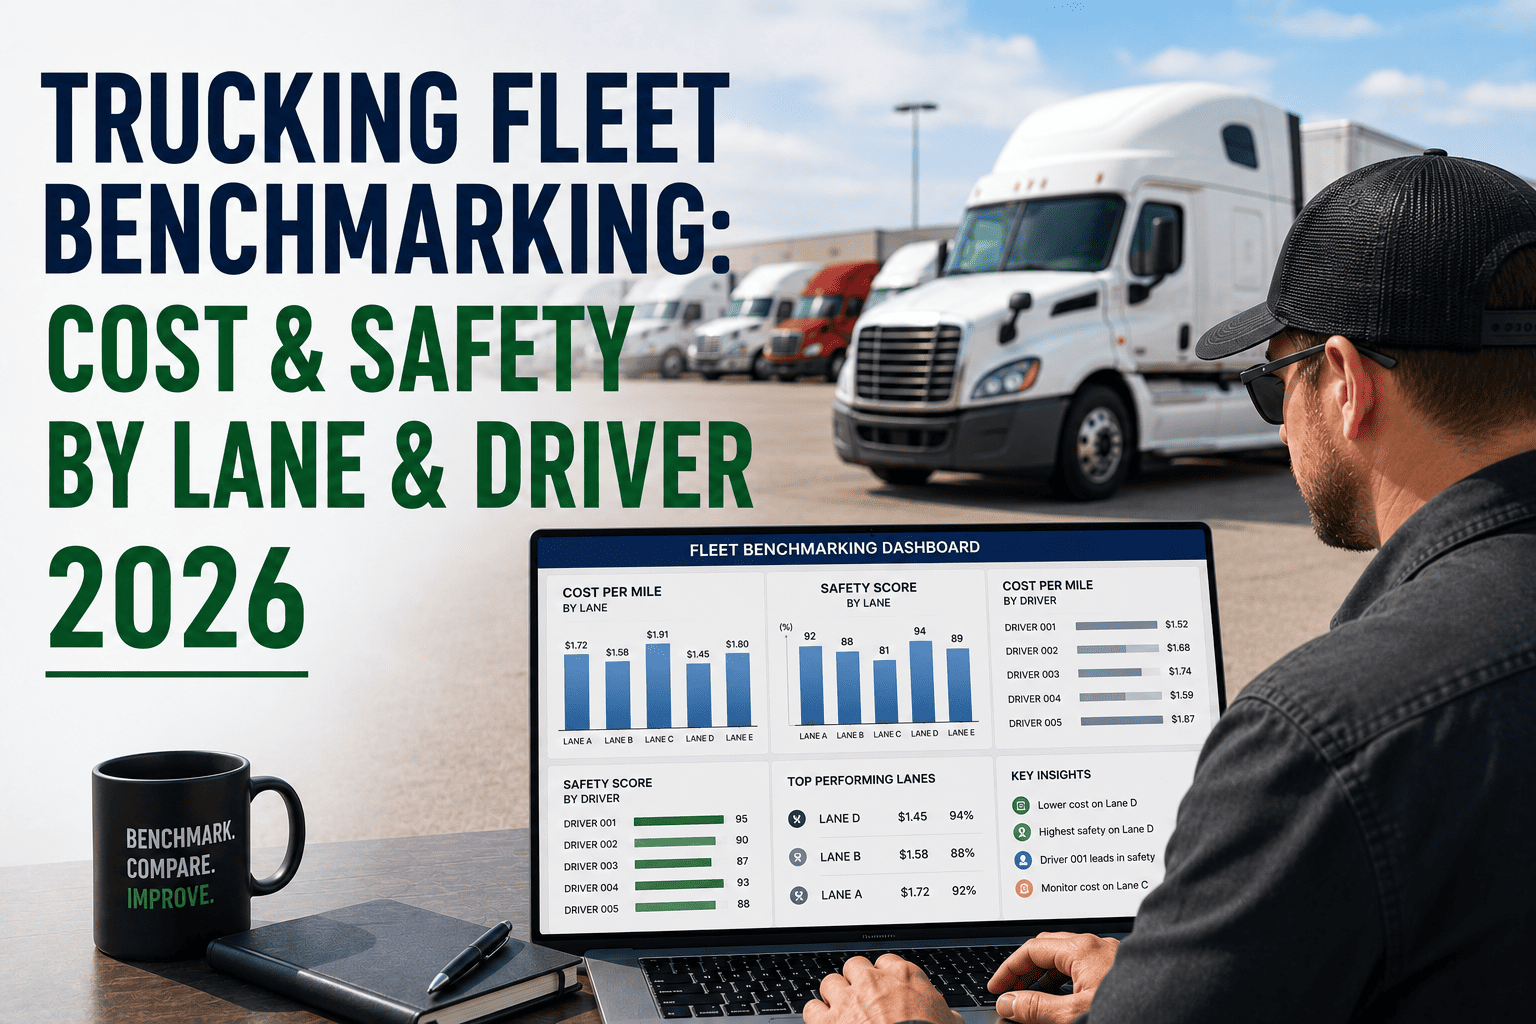
Fleet benchmarking enables trucking companies to compare cost, safety, and productivity metrics across different lanes and drivers in 2026. By analyzing cost per mile, driver performance, and safety scores, fleet managers can identify underperforming routes and operational inefficiencies. Modern analytics platforms provide real-time dashboards and benchmarking tools that support data-driven decision-making. These insights help businesses improve efficiency, optimize resource allocation, enhance driver performance, and increase overall fleet profitability.
Trucking Fleet Benchmarking:
Cost & Safety by Lane and Driver
Fewer than 1 in 3 fleet managers can prove their performance with data. In 2026, the gap between top-quartile and bottom-quartile fleets is worth $200,000+ annually on a 50-truck fleet. Here's how to close it.
A fleet running $0.54/mile in a sector where top performers run $0.38/mile isn't underfunded — it's underinformed. A $0.40/mile gap across 500,000 annual fleet miles equals $200,000 in preventable losses. Benchmarking by lane and driver turns invisible losses into a clear, ranked action list. FleetRabbit does this automatically — across cost, safety, driver, and lane performance.
What Is Fleet Benchmarking — and Why Does Lane and Driver Detail Matter?
Fleet benchmarking is the process of measuring your operational metrics — cost per mile, safety incidents, driver behavior, fuel efficiency — and comparing them against industry standards or peer fleets. But fleet-level averages hide the truth. A fleet "averaging" $1.82/mile might have routes running at $1.45 and others bleeding at $2.60. Aggregated data masks the lanes and drivers responsible for most of your cost overruns.
Lane-level and driver-level benchmarking breaks that average open. It tells you which route is 23% over cost, which driver scores in the bottom quartile for safety events, and which combination of lane and driver is quietly eroding your margins. That's the data you need to act — and it's what FleetRabbit's analytics platform surfaces automatically.
Internal Benchmarking
Compare lanes, drivers, vehicles, and time periods within your own fleet. Find the route consistently over budget. Spot the driver whose fuel efficiency is 15% below team average. Identify vehicles costing twice as much to maintain as comparable units. Internal benchmarking finds your outliers — fast.
External Benchmarking
Compare your fleet's performance against industry peers, ATRI data, and sector-specific standards. Know whether your $1.82 CPM is competitive or a liability. Understand your fleet's true percentile ranking — not just whether you improved over last year, but whether you improved enough.
The 7 Core KPIs Every Fleet Must Benchmark in 2026
Industry data from ATRI, NPTC, and NAFA identifies the metrics that separate top-quartile fleets from the rest. Track these 7 — and benchmark each one by lane and driver, not just fleet-wide. Want to see all 7 on a single dashboard? Sign up free with FleetRabbit.
Cost Per Mile (CPM)
Highest Financial ImpactThe most comprehensive single metric — encompassing fuel, maintenance, insurance, and depreciation. Heavy-duty trucks average $1.82/mile in 2026; top performers hold below $1.56. Fuel is 30–40% of CPM, maintenance 15–20%. Every $0.01 CPM improvement on a 40-vehicle/80K mi/yr fleet saves $32,000 annually.
Vehicle Uptime Percentage
Revenue RecoveryEvery day a vehicle sits idle is lost revenue. The industry average of 8.2% downtime means a truck is unavailable nearly 2.5 days per month. Top performers cut this almost in half. Each 1% uptime gain on a 40-vehicle fleet at $180/hr operational value recovers $252,000 annually.
Driver Safety Score
Insurance & LiabilityFMCSA reports an average 0.74 accidents per 100,000 miles for commercial vehicles. Top fleets achieve under 0.35. A well-performing fleet targets fewer than 3 harsh events per 1,000 miles and under 5 speeding violations per 100,000 miles. CSA scores above 75 trigger increased FMCSA inspections — a direct operating cost.
PM Compliance Rate
Maintenance EfficiencyIndustry top-quartile fleets run 92%+ PM compliance. Fleets below 75% compliance see 2.3× the mean time to repair and 4.1× the emergency parts spend of top performers. A PM compliance improvement from 72% to 85% generates $1,800–$2,400 per vehicle in Year 1.
Fuel Efficiency (MPG)
Operating CostMost fleets aim for 6.5–8.0 MPG for medium-to-heavy duty trucks. Top-performing fleets in 2026 exceed 7.0 MPG for medium-duty. Even governed drivers show 10–20% MPG variation — revealing that driver behavior, not just equipment, determines fuel cost per lane.
Loaded Mile Percentage
Asset UtilizationFleets should aim for 80–90% loaded miles. Vehicles below 50% utilization signal route problems or fleet overcapacity. Most fleets target 65–75% vehicle utilization. Deadhead miles consume fuel without generating revenue — they show up clearly in lane-level benchmarking as cost outliers.
On-Time Delivery Rate
Customer RetentionTop fleets maintain on-time delivery above 95%. Below-benchmark on-time rates create contract penalties, customer defection risk, and emergency re-routing costs. Driver-level on-time tracking reveals whether delays are route-driven or behavior-driven — a critical distinction for targeted coaching.
See Your Fleet's True Performance Rank
FleetRabbit calculates all 7 core KPIs automatically and compares your fleet against 2026 industry benchmarks — by lane, by driver, and by vehicle class. Start your free trial or book a demo to see your fleet's percentile ranking today.
Lane-Level Benchmarking: Where Route Profitability Hides
Most fleet managers know their average cost per mile. Almost none know which specific lanes are profitable and which are destroying margin. Lane-level benchmarking changes that completely — and it's where the biggest hidden savings usually live.
How Lane Benchmarking Works
Break your routes into defined lane segments. Calculate CPM, fuel consumption, on-time rate, and safety events for each lane separately. Compare lanes against each other and against sector benchmarks. A lane running at $2.40/mile when your fleet average is $1.82 isn't just an outlier — at 100,000 annual miles, that's $58,000 in excess annual cost on a single route.
Sample lane benchmark output. FleetRabbit generates this automatically from your telematics and fuel data.
What Causes a Lane to Underperform?
Route Terrain
Mountain grades and urban stop-and-go burn more fuel per mile regardless of driver behavior. Terrain-adjusted benchmarks prevent misattributing route costs to drivers.
Congestion Exposure
Routes through major metro areas accumulate idle time and increase the accident rate. Lane benchmarking separates congestion cost from driver-controllable cost.
Load Density
High deadhead miles on return legs inflate CPM structurally. Lane benchmarking flags these lanes so operations teams can improve backhaul planning and loaded mile percentage.
Driver Assignment
The same route run by two different drivers can show 15–20% CPM variation. Lane-driver overlap analysis identifies when a lane cost issue is actually a driver behavior issue in disguise.
Driver-Level Benchmarking: Building a Performance Scorecard
Driver performance is the most controllable variable in fleet cost. A "lead-foot" driver uses up to 20% more fuel than the fleet average. A driver with poor safety habits raises your insurance premiums, CSA scores, and liability exposure. Driver-level benchmarking turns these invisible differences into ranked, actionable data. Book a FleetRabbit demo to see how driver scorecards work in practice.
The 5-Dimension Driver Scorecard
Fuel Efficiency
MPG vs. fleet average, by route type. A driver improving from 6.0 to 7.0 MPG saves $10,000/year. Track weekly to surface trends before they become costly patterns.
Safety Events
Hard braking, rapid acceleration, speeding violations. Target fewer than 3 harsh events per 1,000 miles. Drivers above 5 events/1,000 miles typically cost 2× more in maintenance and insurance.
Idle Time
Idle percentage vs. fleet policy. Less than 15% of engine runtime should be idle. At $4.80/gal, each 100 hours of idle burned is $432 lost — trackable directly to the driver and shift.
On-Time Performance
Delivery punctuality vs. scheduled windows. Driver-level on-time tracking separates route-caused delays from behavior-caused delays — a key distinction for coaching conversations.
HOS Compliance
Hours of Service adherence to FMCSA regulations. Violations risk $16,000 fines per incident and CSA score increases. Driver-level HOS tracking makes violations visible before they become regulatory events.
Driver Tier Classification
Use benchmark data to classify every driver into performance tiers — then direct coaching resources where they have the most impact. Sign up for FleetRabbit to get automated driver tier reports updated weekly.
Fleet Type Benchmarks: Comparing Apples to Apples
The most common benchmarking mistake is comparing your fleet to the wrong peer group. An 8.0 MPG reading is exceptional for a construction fleet — and poor for a highway tractor. Benchmark against your sector, not the industry average. Wrong peer groups produce misleading gap analysis and misdirected investments.
Long-Haul / OTR
Regional Delivery
Last-Mile / Urban
Specialized / Hazmat
How FleetRabbit Powers Your Benchmarking Program
Benchmarking is only as good as the data behind it. Manual spreadsheets create gaps, delays, and errors. FleetRabbit automates the entire benchmarking cycle — from data collection to peer comparison to ranked action lists — so your team spends time fixing problems, not calculating them. Start your free trial and get your first benchmark report in 24 hours.
Connect Your Data
FleetRabbit integrates with your existing telematics, fuel cards, and ELD systems in minutes. No manual data entry. No spreadsheet juggling. Your KPIs begin calculating automatically from day one.
See Your Baseline
Within 24 hours, your fleet's 7 core KPIs are calculated and displayed alongside 2026 industry benchmarks for your fleet type. You'll see exactly where you rank — and which gaps are costing you the most.
Drill to Lane and Driver
Break every metric down by lane, driver, vehicle, and time period. See which Houston-Miami runs are outliers. Identify the driver whose fuel efficiency trails the team by 18%. Ranked gap lists show you exactly where to act first.
Track Improvement Weekly
Benchmark monthly on operational KPIs, quarterly on strategic metrics. FleetRabbit's automated reports show whether your interventions are working — with before-and-after comparisons that prove ROI to leadership.
Your Fleet Deserves a Real Performance Ranking
FleetRabbit's benchmarking platform gives you the lane-level and driver-level data that fleet averages hide. See your cost per mile by route. Rank every driver on a 5-dimension scorecard. Compare against 2026 industry peers automatically. Sign up free — no credit card needed. Or book a 30-minute demo to see it live on your fleet data.
Frequently Asked Questions
Key Takeaways for 2026
Fleet averages hide the truth. A $1.82 average CPM may contain lanes at $1.45 and lanes at $2.60 — lane-level benchmarking exposes which is which.
A $0.40/mile gap vs. top quartile equals $200,000 annual loss on 500,000 fleet miles. Benchmarking converts invisible losses into a ranked action list.
Driver behavior is the most controllable variable. A single driver improving from 6.0 to 7.0 MPG saves $10,000/year — multiplied across 50 drivers, that's transformative.
Benchmark monthly, not annually. Annual reviews miss 11 months of correctable performance drift. FleetRabbit updates your rankings automatically every reporting period.
The fleets that win in 2026 aren't the ones with the biggest budgets — they're the ones with the clearest picture of their performance. Start your free FleetRabbit trial or book a demo to see your fleet's true benchmark position today.







