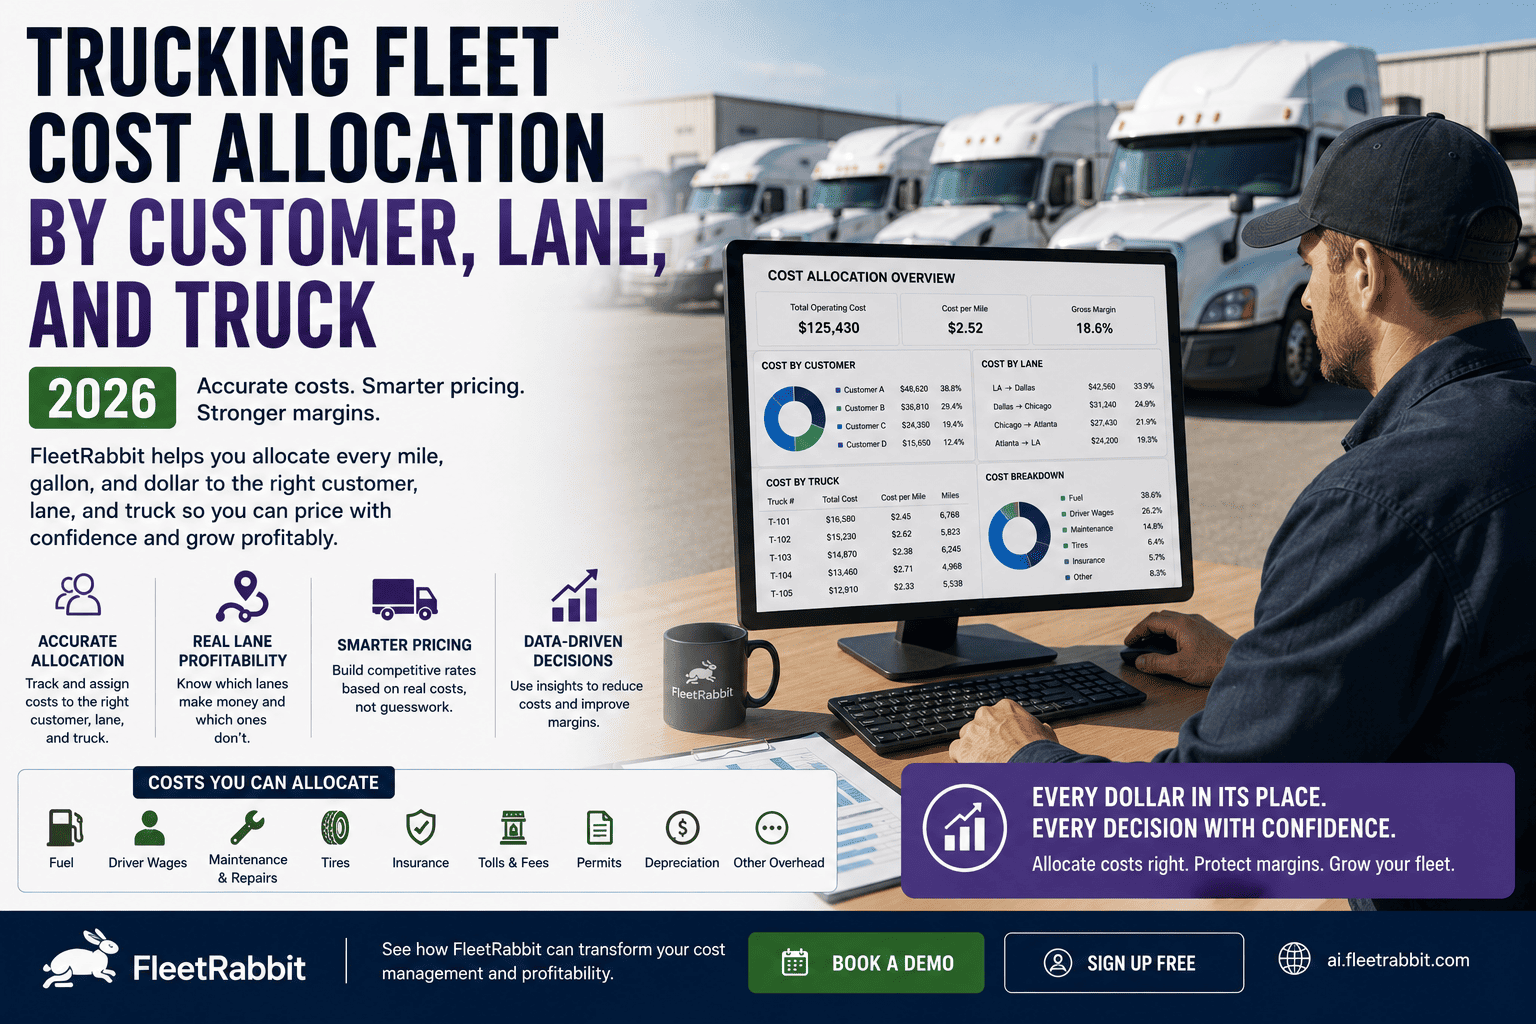
Most fleets know their total revenue and their total cost down to the dollar. What they don't know is which customer, which lane, and which truck actually produced that profit, and which ones quietly ate it. With trucking margins commonly running just 2 to 8 percent, that blind spot isn't a minor gap, it's the difference between a fleet that grows and one that slowly bleeds cash while looking profitable on paper.
This guide breaks down how to allocate cost by customer, lane, and truck so the real picture finally shows up. If you'd rather see this built automatically against your own data, you can sign up for FleetRabbit and connect your fleet in minutes, or book a demo to see a live profitability breakdown of a fleet like yours.
Accurate fleet cost allocation means splitting direct costs, like fuel for a specific truck, its assigned driver, and its maintenance work orders, from shared costs, like insurance and dispatch overhead, and mapping both against revenue by customer, lane, and truck. Carriers who do this typically find that 15 to 25 percent of their customer book is unprofitable, and that a handful of trucks or lanes are quietly losing money while the fleet-wide total still looks healthy.
Three Lenses, One True Profit Number
Fleet-wide revenue minus fleet-wide cost gives you one number. It does not tell you where that number came from. Real visibility requires looking at the same operation through three different lenses at once.
Why Fleet-Wide Averages Hide the Problem
A fleet can run a healthy blended margin while one truck loses thousands a month and another makes far more than its share. Without breaking revenue and cost down by asset, route, and account, that imbalance stays invisible, bad trucks keep running, unprofitable lanes keep getting booked, and demanding customers keep getting the same priority as the accounts actually funding the business.
The Number That Should Concern Every Fleet Manager
Carriers who run a per-customer breakdown for the first time commonly discover that 15 to 25 percent of their customer book is unprofitable, often without anyone noticing until the numbers are laid out side by side.
Splitting Direct Costs From Shared Costs
Cost allocation starts with separating expenses that clearly belong to one truck or load from expenses that belong to the whole operation and need a fair split.
- Fuel for that specific truck
- Pay for the assigned driver
- Maintenance work orders on that unit
- Tolls incurred on that route
- Insurance premiums
- Dispatch and admin overhead
- Yard and facility costs
- Software and back-office systems
Shared costs typically get allocated by mileage share, revenue share, or an even split across active trucks, and the method should stay visible and adjustable rather than buried in a spreadsheet formula nobody remembers building.
Why Rate Per Mile Alone Is Misleading
Rate per mile tells you what a customer pays. It says nothing about deadhead miles, tolls, or detention, which is exactly why two loads at the identical rate can produce very different profit.
Same posted rate, a $219 profit gap from a single load decision. Miss that pattern twice a week on similar lanes and it adds up to a substantial loss across a year, invisible unless the allocation math runs at the lane level rather than the rate-per-mile headline.
FleetRabbit pulls revenue, fuel, maintenance, tolls, and driver cost into one profitability view, so you know exactly which trucks, lanes, and customers are making money. Sign up to connect your data today, or book a demo to see your own fleet's real margin breakdown.
Building an Allocation System That Sticks
A cost allocation model only works if it's easy enough to maintain that someone actually keeps it updated. These four steps keep it manageable.
| Cost Category | Allocation Type | Typical Method |
|---|---|---|
| Fuel | Direct | Tied to fuel card transactions per truck |
| Driver Pay | Direct | Tied to assigned driver and load |
| Maintenance | Direct | Tied to work orders per vehicle |
| Tolls | Direct | Tied to route taken per load |
| Insurance | Shared | Split by mileage or revenue share |
| Dispatch & Admin | Shared | Even split or revenue share across active trucks |
FleetRabbit builds a live profitability view by customer, lane, and truck from the data you already have, no manual spreadsheet exports required. Sign up to get your allocation dashboard running, or book a demo and we'll walk through your fleet's specific numbers.
Frequently Asked Questions
With margins this thin, one unprofitable customer or lane can quietly cancel out the work of your best trucks. FleetRabbit breaks cost and revenue down by customer, lane, and truck so nothing stays hidden in a fleet-wide average.







