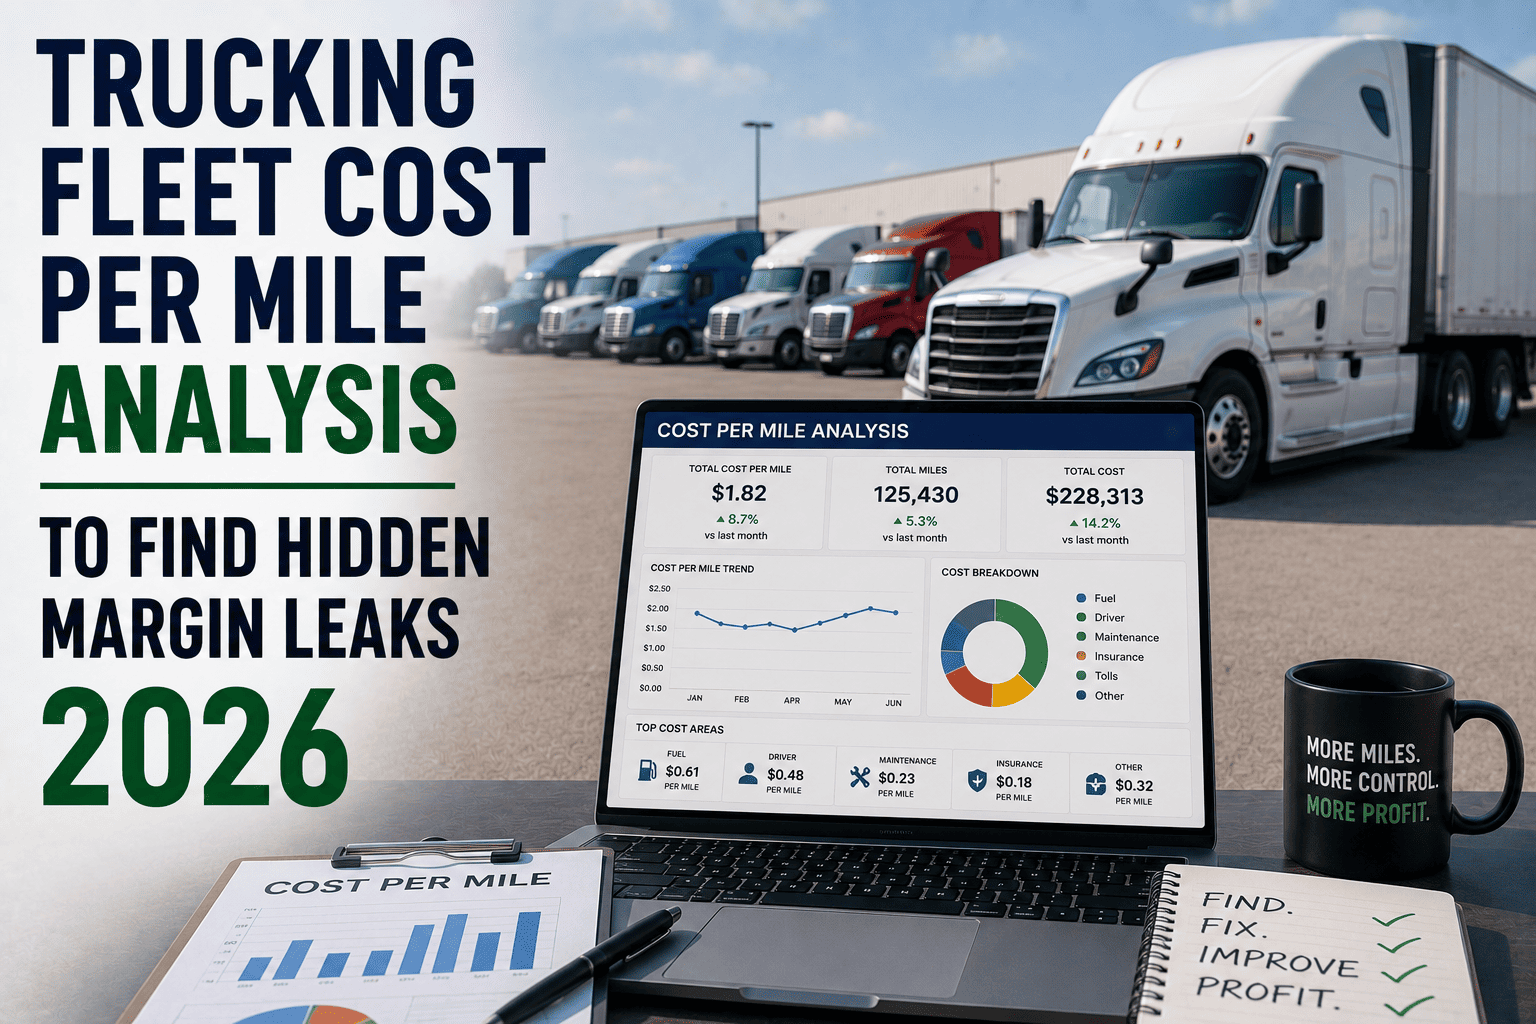
Cost per mile (CPM) analysis is essential for trucking fleets looking to uncover hidden margin leaks and improve profitability in 2026. By analyzing expenses such as fuel, maintenance, idle time, and vehicle utilization, fleet managers can identify inefficiencies that impact financial performance. Modern fleet analytics platforms provide real-time insights into operating costs and key performance metrics, enabling data-driven decision-making. With accurate CPM tracking, trucking companies can reduce unnecessary expenses, optimize resource utilization, and increase overall operational efficiency and profit margins.
Fleet Cost Analysis & Profitability
Trucking Fleet Cost Per Mile Analysis to Find Hidden Margin Leaks in 2026
Your fleet might be profitable on paper and quietly losing money on the road. A proper cost per mile analysis shows exactly which trucks, lanes, and habits are eating your margin — before they eat your year.
Most fleet managers can tell you total miles driven and total fuel spent this month. Far fewer can tell you the true cost per mile, truck by truck. That gap is exactly where margin quietly disappears, and it's the gap a real cost per mile analysis is built to close. The trucks that look fine on a summary report are often the ones costing you the most: a unit averaging 15% more idle time, a trailer sitting at 38% utilization, a driver burning 0.8 MPG less than the fleet average. None of this shows up until you break costs down per mile, per vehicle, per route. This guide walks through exactly how that breakdown works, what 2026 benchmarks actually look like, and how to put it to use before your next bid, lease decision, or fleet review.
What Cost Per Mile Actually Tells You
Cost per mile (CPM) is total operating cost divided by miles driven. Simple math — but the number is only useful if it's built correctly, and most fleets build it wrong.
The core formula
The biggest mistake fleets make: dividing by total miles instead of revenue miles. Deadhead and empty repositioning miles inflate your mile count and make your true cost per loaded mile look better than it is.
Fixed costs vs. variable costs
Fixed — paid whether the truck moves or not
- Truck payment or lease
- Insurance premiums
- Permits, licensing, ELD subscriptions
- Fleet software and admin overhead
Variable — scales with miles driven
- Fuel
- Maintenance and tires
- Tolls and DEF fluid
- Driver pay tied to mileage
According to ATRI, the average fully-loaded cost of operating a truck reached $2.26 per mile, with non-fuel costs alone hitting a record $1.78 per mile. If your fleet doesn't know where it sits against that number today, a quick sign up for FleetRabbit gets per-truck CPM calculated automatically from data you already have.
The Five Places Margin Quietly Leaks Out
Fleet-wide averages hide outliers. These are the five leak points that show up only when you analyze cost per mile at the individual vehicle level.
Idle time
A truck idling 8 hours a day, 300 days a year wastes roughly $6,000 in fuel annually for zero productive miles. Across a 100-truck fleet, just 2 extra hours of daily idling pushes that waste past $1.5 million a year.
Low utilization
Best-in-class long-haul fleets run at 70–80% utilization. Mixed fleets often average only 45–60%, while still paying full fixed costs — $8,000 to $15,000 per truck per month — on units barely earning their keep.
Driver behavior variance
Speeding, harsh braking, and idling habits can swing fuel and maintenance cost by 15–20% between two identical trucks on the same route — a controllable cost most fleets never isolate.
Deadhead and empty miles
Every empty repositioning mile carries real cost and zero revenue. Calculating CPM against total miles instead of revenue miles hides exactly how much this is costing per load.
Unplanned downtime
Unplanned breakdowns average 2.4 days per event. At $1,200–$2,000 in lost revenue capacity per day, one avoidable breakdown can cost $2,900–$4,800 before repair bills even arrive.
See your own leaks
FleetRabbit surfaces every one of these per truck, automatically, from data you're already collecting.
Book a demoWhere a Trucking Dollar Actually Goes
A typical fully-loaded cost per mile breaks down roughly like this. The exact split shifts with fuel prices and truck age — but the structure rarely changes.
Based on aggregated 2024–2026 ATRI and industry operating-cost data. Fuel and driver pay alone make up roughly 70% of every mile — which is exactly why small efficiency gains in those two categories move the needle fastest.
Stop Estimating. Start Measuring.
Most fleets are one dashboard away from knowing exactly which trucks are profitable and which ones are quietly draining cash. Sign up for FleetRabbit and see your real cost per mile calculated automatically — truck by truck, route by route.
How to Run a Real Cost Per Mile Analysis
A useful CPM analysis isn't a once-a-year spreadsheet exercise. It's a recurring process built on four steps.
Separate fixed from variable costs, per truck
Pull truck payments, insurance, fuel, maintenance, tolls, and driver pay into separate buckets for every individual unit — not a fleet-wide blend that hides outliers.
Use revenue miles, not total miles
Divide cost by miles actually driven under a load. This is the only way to see your true cost of generating revenue, rather than a softened number padded by deadhead miles.
Layer in idle time and utilization
Connect GPS and telematics data to flag units idling above 15% of engine-on time, or running below 60% utilization — both are early signals of a margin leak before it shows up in the P&L.
Compare units against the fleet average — monthly
A truck costing 40–80% more per mile than fleet average won't show up in an annual review. Monthly comparison catches it while there's still time to act — repair it, reroute it, or retire it.
Doing this by hand across a fleet of 20, 50, or 200 trucks is exactly the kind of work that should be automatic. Book a demo to see how FleetRabbit pulls GPS mileage, fuel card data, and work order costs into one live cost-per-mile view.
2026 Benchmarks Worth Knowing
Use these as a sanity check against your own fleet's numbers before you decide what's actually a problem.
| Metric | Healthy range | Investigate below / above |
|---|---|---|
| Fleet-wide utilization rate | 70–80% | Below 60% |
| Idle time (% of engine-on hours) | Under 15% | Above 25% |
| Fleet availability for dispatch | 92–96% | Below 88% |
| Fuel cost per mile (large fleets) | $0.55–$0.65 | Above $0.72 |
| Fully-loaded operating cost per mile | $1.80–$2.30 | Above $2.50 |
Sourced from ATRI operational cost benchmarks, NACFE fleet fuel studies, and 2026 telematics industry data. Your own targets should adjust for fleet type, region, and truck age.
One Example: What Idle Time Alone Can Cost
Here's how fast a "minor" habit compounds across a fleet — using a fuel cost of $4.50 per idle hour, a conservative industry estimate.
One truck idling 3 extra hours a day, 250 days a year
≈ $1,125 / yearSame habit, fleet of 25 trucks
≈ $28,125 / yearSame habit, fleet of 100 trucks
≈ $112,500 / yearThis is one leak, in one category, from one habit. A full cost per mile analysis catches this kind of pattern automatically — instead of waiting for someone to notice it in the fuel bill.
Why This Matters More in 2026
Diesel volatility is back
National diesel averages have moved sharply this year. A $0.20 increase per gallon adds roughly $0.03 to cost per mile — about $3,600 per truck annually across typical mileage.
Spot rates haven't caught up
Non-fuel operating costs have climbed faster than spot freight rates in many lanes, squeezing the margin between what you're paid and what each mile actually costs you.
Insurance keeps climbing
A 10-point increase in CSA score alone can add 8–15% to commercial auto liability premiums — a cost that compounds quietly into your fixed-cost base.
Capital decisions need real data
Hold-or-replace decisions made on gut feel, instead of per-unit CPM, are how fleets end up keeping the wrong trucks two years too long.
Frequently Asked Questions
What is a good cost per mile for a trucking fleet in 2026
Most full-time operations land between $1.80 and $2.30 per mile fully loaded, depending on truck age, fuel economy, and region. If your fleet sits meaningfully above $2.50 per mile, it's worth investigating fuel economy, financing terms, or maintenance patterns before assuming the market is simply tougher.
How is cost per mile different from rate per mile
Rate per mile is what a shipper or broker pays you. Cost per mile is what it actually costs to run that truck for that mile. The space between the two is your real profit — which is why tracking CPM matters more than tracking gross revenue alone.
Should I calculate cost per mile using total miles or revenue miles
Revenue miles give a far more accurate picture. Total miles include deadhead and repositioning miles that carry cost but generate no income, which artificially lowers your apparent cost per mile and can lead to underbidding.
How often should fleets review cost per mile data
Monthly, at minimum, and by individual unit rather than fleet-wide average. A high-cost outlier can hide inside a healthy fleet average for months if you're only reviewing totals once a year.
Can software really catch margin leaks a spreadsheet misses
Yes — mainly because of speed and consistency. Software like FleetRabbit pulls GPS mileage, fuel card transactions, and maintenance records automatically, so leaks like rising idle time or falling utilization get flagged within weeks instead of being discovered at year-end.
What's the fastest way to start improving fleet cost per mile
Start with idle time and utilization — they're the two metrics most fleets don't track but can improve the fastest. A free sign up at FleetRabbit gives you a live, per-truck view of both within days, not months.
Your Fleet's Real Margin Is Hiding in Plain Sight
Every leak in this guide — idle time, low utilization, driver variance, deadhead miles, downtime — is measurable today with the data your fleet already generates. The only missing piece is putting it together. Sign up for FleetRabbit to see your cost per mile by truck, or book a personalized demo and we'll walk through your own fleet's numbers together.







