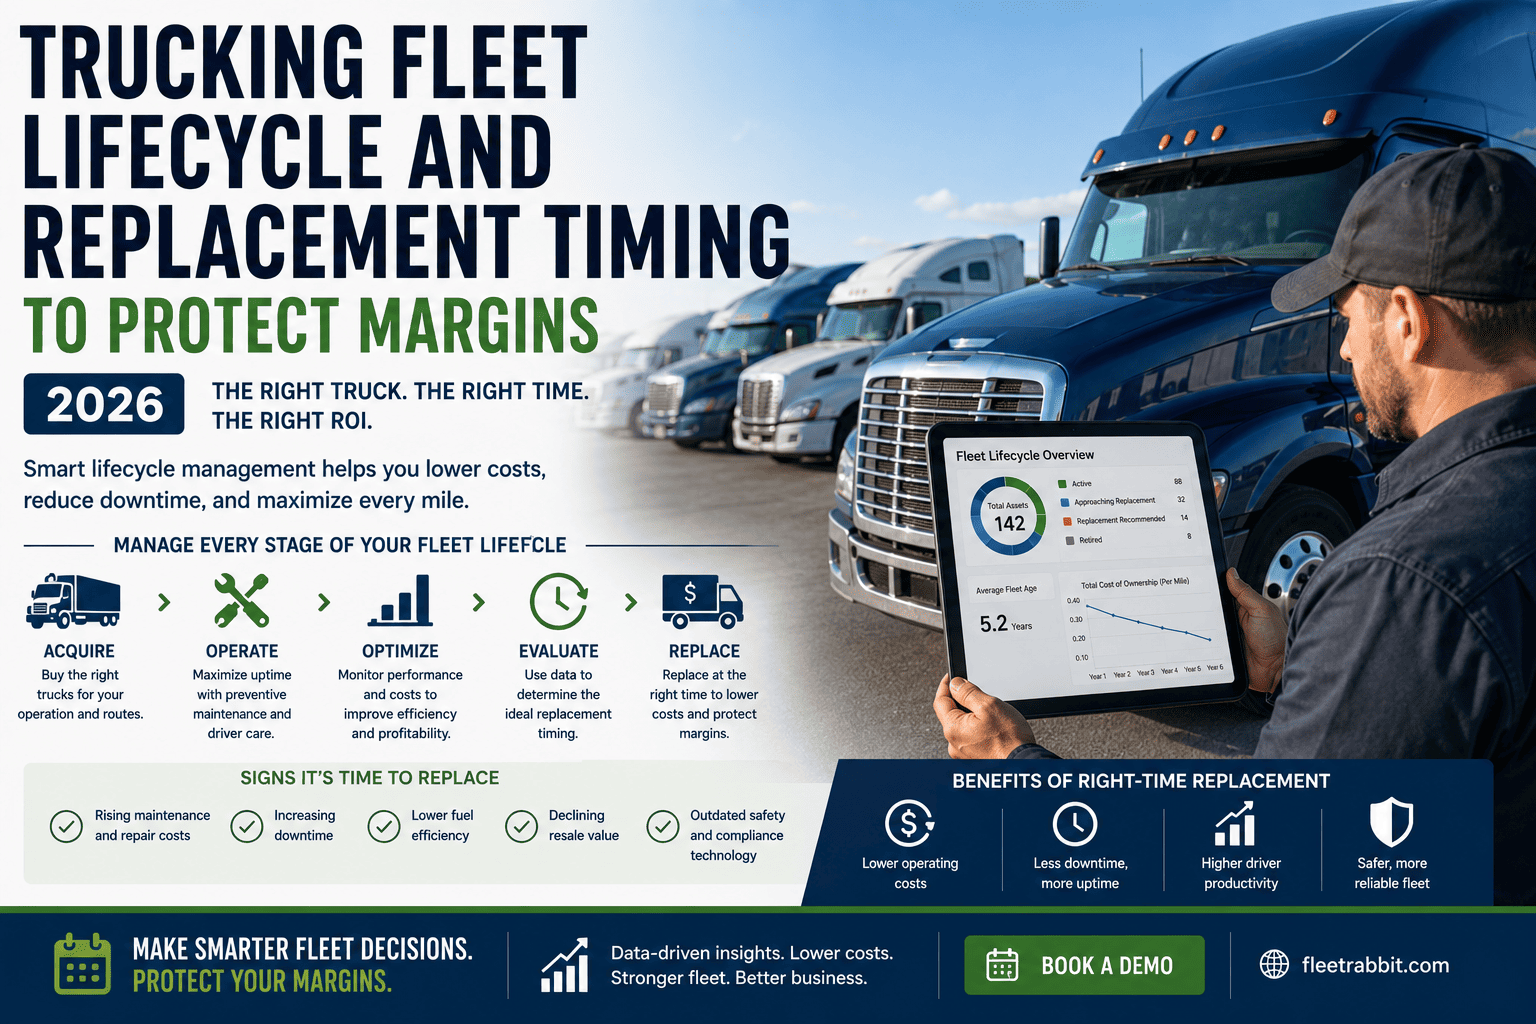
Every truck in your fleet is quietly telling you when it should be replaced. The signal isn't a single breakdown or a round number on the odometer, it's the moment when the cost of keeping a vehicle running starts to outpace the cost of putting a new one on the road. Most fleets miss that moment by a year or two, and that gap is where margins quietly disappear.
This guide walks through how to actually find that replacement point for your fleet, using cost-per-mile data instead of gut feeling. If you'd rather see this calculated automatically against your own vehicles, you can sign up for FleetRabbit and get the numbers in minutes, or book a demo to walk through your fleet's replacement case with our team.
Most heavy-duty trucks reach their economic replacement point between 500,000 and 750,000 miles, or roughly 7 to 9 years in service, which is when rising maintenance and downtime costs start to exceed the annualized cost of a new vehicle. Vehicles kept past that point can cost 5 times more per mile to maintain than a comparable newer asset, which is why tracking cost-per-mile by vehicle age matters more than following a fixed replacement calendar.
The Cost Curve Every Fleet Manager Should Know
Vehicle cost per mile doesn't rise in a straight line. It stays low for years, then climbs sharply once a truck crosses a certain age threshold. Seeing that curve laid out by age bracket makes the replacement decision far less abstract.
Why the Jump Happens So Fast
Depreciation is highest in a truck's first three years, sometimes 35 to 40 percent of its value, then it flattens out. Maintenance moves in the opposite direction: low and predictable early, then it compounds. Once a truck passes roughly year seven, maintenance costs can climb 25 to 30 percent annually as components that were never replaced together start failing together. Vehicles over 10 years old don't just cost more, they average far more unplanned downtime than a 0 to 3 year old truck, turning a maintenance budget problem into a service reliability problem at the same time.
The Number That Gets Overlooked
Aging vehicles often represent less than a fifth of total fleet capacity while consuming close to a third of total service spend. That imbalance is usually invisible until someone tracks cost per mile by individual vehicle age, which is exactly the kind of view a fleet management platform builds automatically instead of requiring a spreadsheet exercise every quarter.
Finding Your Fleet's Sweet Spot
The replacement "sweet spot" is the point where the declining cost of depreciation crosses the rising cost of maintenance and downtime. Before that point, you're leaving useful vehicle life on the table by replacing too early. After it, every additional mile costs more than the truck's lifetime average.
Duty Cycle Changes the Timeline
A long-haul tractor running 120,000 miles a year hits its economic life on mileage, typically 5 to 7 years or 600,000 to 800,000 miles. A regional or vocational truck that racks up far fewer miles annually still ages out on the calendar, usually between 8 and 10 years, because corrosion and component aging happen regardless of odometer reading.
| Fleet Type | Typical Replacement Age | Typical Replacement Mileage | Primary Driver |
|---|---|---|---|
| Light-Duty | 7-8 years | ~150,000 miles | Mileage-driven component wear |
| Medium-Duty | 8-10 years | ~200,000 miles | Combination of age and duty cycle |
| Heavy-Duty Long-Haul | 5-7 years | 600,000-800,000 miles | High annual mileage accumulation |
| Heavy-Duty Regional/Vocational | 8-10 years | Lower relative mileage | Calendar age, corrosion, component aging |
FleetRabbit tracks maintenance cost, downtime, and total cost of ownership for every truck automatically, so you can spot which vehicles have crossed their sweet spot. Sign up and connect your fleet data today, or book a demo and we'll build the replacement case with your actual numbers.
Building a Total Cost of Ownership Formula That Holds Up
Total cost of ownership only means something if it accounts for everything a truck actually costs across its life, not just the purchase price and fuel. A usable formula factors in acquisition cost minus projected residual value, plus every operating cost incurred along the way.
Why Age, Not Just Mileage, Matters
Two trucks with the same odometer reading can have very different costs if one is four years old and the other is twelve. Component aging and corrosion accumulate on the calendar regardless of how many miles were driven, which is why a low-mileage older truck can still cost more per mile to run than a higher-mileage newer one.
A Habit Worth Building
Divide total annual cost by miles driven for every vehicle, every quarter, rather than relying on fleet-wide averages. Averages hide the handful of aging trucks that are quietly draining the budget while newer vehicles look like they're carrying the fleet.
Signs Your Fleet Has Passed the Replacement Window
A few consistent warning signs show up once a vehicle has crossed its economic sweet spot, and catching them early turns a reactive scramble into a planned procurement.
Planning the Replacement Itself
Finding the sweet spot is only half the job. Executing the replacement without a service gap takes lead time, especially for anything beyond a stock chassis.
FleetRabbit calculates total cost of ownership, tracks maintenance trends by vehicle age, and flags assets approaching their sweet spot automatically. Sign up to see your fleet's numbers today, or book a demo and let our team show you the replacement report leadership actually approves.
Frequently Asked Questions
The longer a vehicle stays past its sweet spot, the more it costs on every mile. FleetRabbit gives you the cost-per-mile visibility to replace at exactly the right moment, not a year too late.







