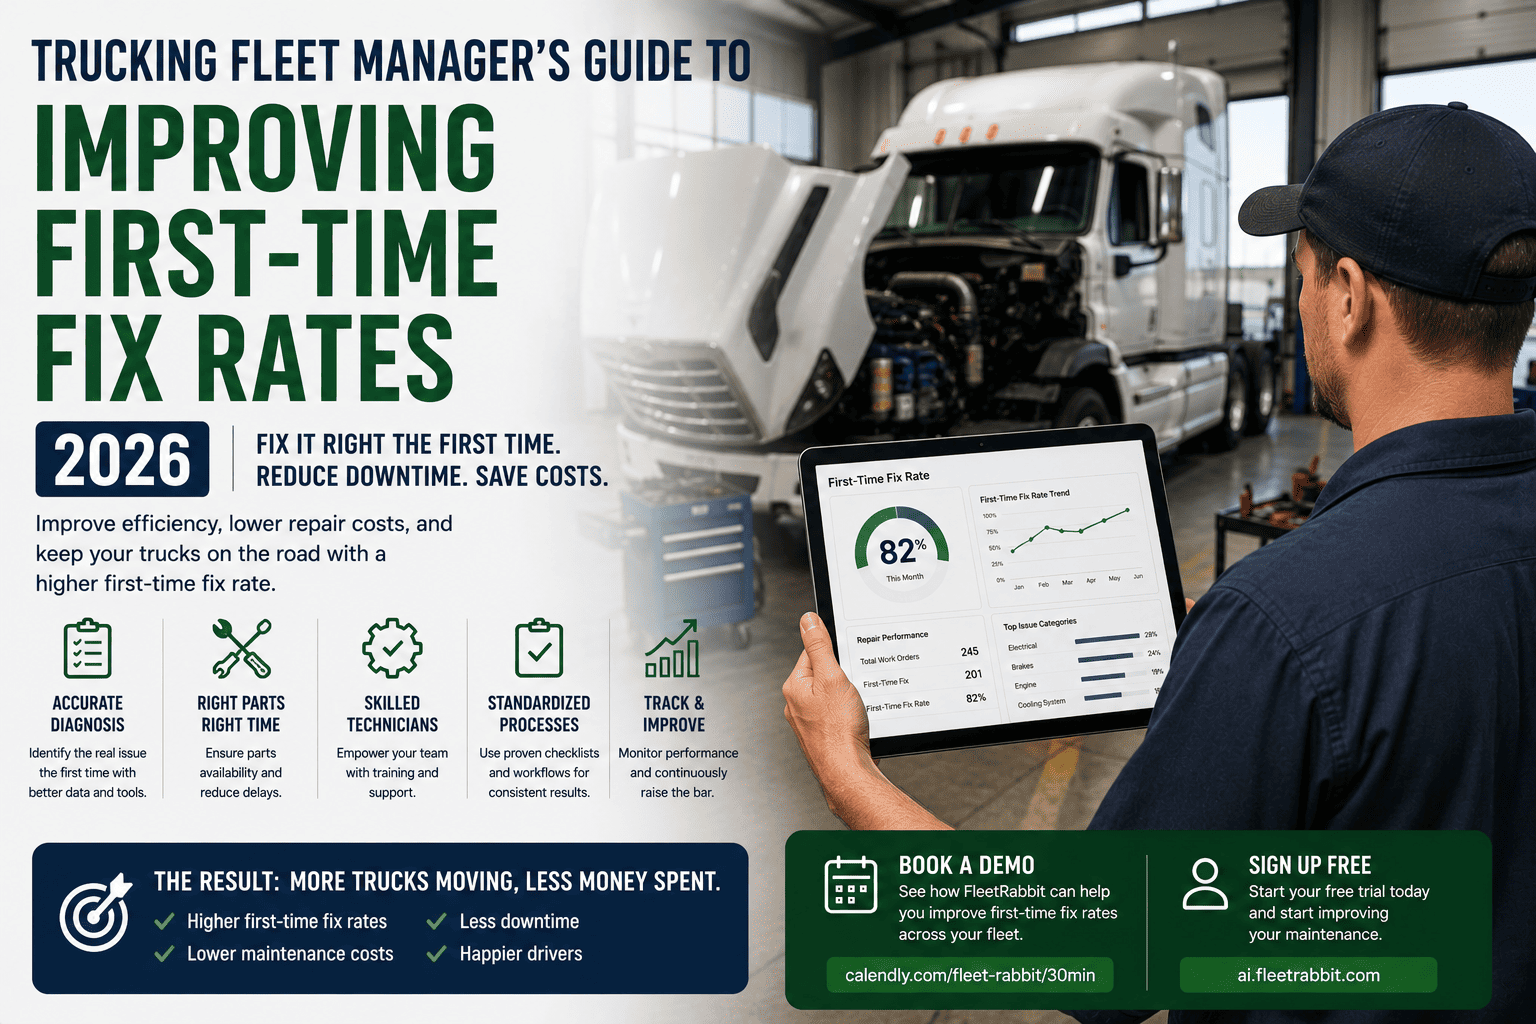
A truck that comes back to the shop twice for the same problem costs a fleet more than the second repair invoice. It costs a second round of diagnostic time, a second parts order, and another day the vehicle sits idle instead of earning revenue. First-time fix rate, the percentage of repairs solved correctly on the first visit, is one of the clearest signals of whether a maintenance operation is actually working or just staying busy. Sign up for FleetRabbit to see your fleet's first-time fix rate and the repeat visits driving it down, or book a demo to walk through what's causing your repeat shop trips.
First-time fix rate equals the number of repairs completed correctly on the first visit divided by total repair jobs. The 2026 industry target is 80 percent or higher, and fleets below 85 percent are considered to have a systemic problem worth investigating. Every repeat visit adds hours directly to average repair time, and a truck that needs a second trip for the same issue often costs 2 to 3 times the original repair estimate once labor, parts reordering, and extra downtime are added together.
What First-Time Fix Rate Actually Measures
First-time fix rate sounds simple, but it is one of the most revealing numbers in a maintenance operation because it exposes exactly where a repair process breaks down. A fleet can have skilled technicians and still post a poor first-time fix rate if those technicians are working without the maintenance history, diagnostic data, or parts availability they need to solve a problem on the first attempt.
The Formula and What Good Looks Like
First-time fix rate is calculated as jobs fixed on the first visit divided by total repair jobs, multiplied by 100. A fleet that completes 8 out of every 10 repairs correctly on the first attempt is running at 80 percent, which is the current industry target. Fleets consistently above 90 percent are considered top performers, while anything below 85 percent typically points to gaps in diagnostics, parts stocking, or technician information access that are worth investigating directly.
Why a Low Rate Quietly Inflates Every Other Metric
A weak first-time fix rate does not just cost money on its own. It drags down average repair time, since every repeat visit adds hours to the clock for that job. It reduces vehicle availability, since a truck waiting on a second appointment sits idle longer than the original estimate suggested. It also increases technician frustration and overtime, since the same crew is effectively doing the same job twice. Fixing the root causes behind a low first-time fix rate tends to improve several other maintenance metrics at once.
FleetRabbit tracks every repair, every repeat visit, and every root cause behind it, so you can see exactly where diagnostics, parts, or process are costing you a second trip. Sign up to pull your fleet's repair history, or book a demo to see the repeat-visit report in action.
The Root Causes Behind a Failed First Attempt
Repeat visits rarely happen because a technician lacks skill. They happen because the technician is missing something they needed before starting the job. Identifying which gap is most common in your shop points directly to where to invest first.
| Root Cause | How It Shows Up | Impact on Repeat Visits | Fix |
|---|---|---|---|
| Incomplete Maintenance History | Technician unaware of prior repairs, recurring faults, or known component issues | High. Leads to treating symptoms instead of the actual recurring fault | Digital, searchable service history attached to each vehicle |
| Weak Pre-Dispatch Diagnostics | Job dispatched based on driver description alone, without a diagnostic read | High. Technician starts troubleshooting from zero on arrival | Telematics fault codes and diagnostic data attached to the work order before dispatch |
| Parts Unavailability | Correct diagnosis made, but the needed part is not in stock | Medium to high. Correct fix delayed by a full parts ordering cycle | Inventory tied to common failure patterns by vehicle and component type |
| Incomplete Work Orders | Findings, torque specs, or part numbers not documented from the prior visit | Medium. Next technician repeats investigation steps already completed | Standardized digital work order templates with mandatory findings fields |
| Technician Skill Gaps | Newer or cross-trained technicians unfamiliar with a specific system | Medium. Concentrated in specific repair categories rather than fleet-wide | Targeted training tied to the repair categories with the lowest fix rates |
Building the Four Ingredients of a High First-Time Fix Rate
Fleets that consistently post strong first-time fix rates are not relying on luck or unusually talented technicians. They have built a repair process where the right information, the right parts, and the right documentation are in place before a wrench ever touches the truck.
Give Every Technician the Full Maintenance History
A technician who can see every prior repair, part replacement, and recurring fault on that specific vehicle starts the job already knowing what has been tried before, instead of repeating investigation steps a previous visit already completed.
Attach Diagnostic Data Before the Truck Reaches the Bay
Telematics fault codes and sensor data captured at the moment an issue is reported give the shop a head start on diagnosis before the vehicle even arrives, turning a cold troubleshooting job into a confirmed repair plan.
Match Parts Inventory to Actual Failure Patterns
Stocking parts based on which components fail most often for each vehicle type, rather than generic reorder points, means a correct diagnosis can be acted on immediately instead of waiting on a parts order.
Capture Every Finding in a Digital Work Order
Detailed digital documentation of what was checked, what was found, and what was replaced ensures that if a truck does come back, the next technician is building on real information instead of starting over.
What a Higher First-Time Fix Rate Is Worth
Moving a fleet's first-time fix rate from 70 percent to 85 percent has a direct, compounding effect on cost and uptime. Fewer repeat visits mean fewer duplicated diagnostic hours, fewer emergency parts orders, and fewer vehicles sitting idle waiting for a second appointment. For a fleet running 50 trucks with an average of 300 shop visits a year, closing that gap can eliminate 40 to 50 repeat visits annually, each one avoiding several hundred dollars in duplicated labor and downtime. The improvement also compounds into other KPIs finance teams track closely, including average repair time and overall vehicle availability.
Frequently Asked Questions
Every repeat shop visit is a signal that your technicians are missing information they needed the first time. FleetRabbit brings maintenance history, diagnostics, and work orders together so repairs get done right on the first attempt. Start your free trial with no credit card required, or book a demo to see your fleet's first-time fix rate today.







