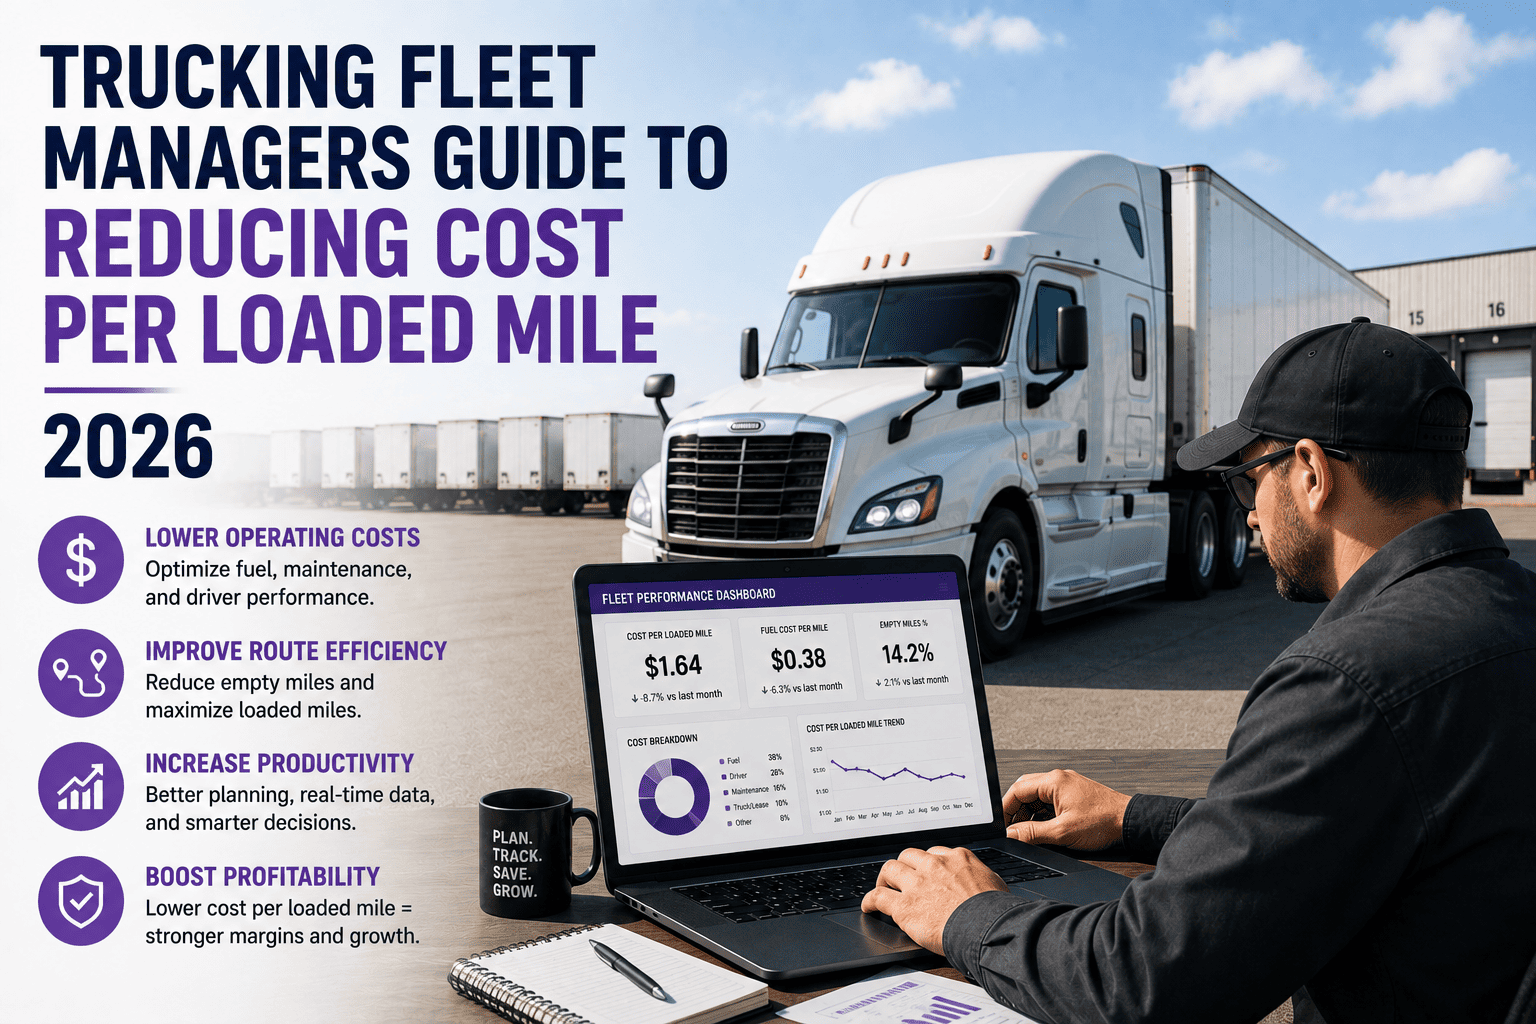
Every load you haul carries two numbers that matter more than almost anything else in your business: what you charged for it, and what it actually cost you to deliver it. In 2026, that second number is climbing faster than most fleet managers can react to. Repair bills are up, tolls are up, tires are up, and every empty mile between loads is quietly eating into the only miles that actually pay you. Cost per loaded mile is the metric that cuts through the noise, and fleets that track it closely are the ones staying profitable while everyone else absorbs the damage.
Average truck operating cost climbed to roughly 2.34 dollars per mile in 2025, the highest figure ever recorded, with non-fuel costs alone reaching 1.85 dollars per mile. Once you factor in empty miles running between 15 and 17 percent of total mileage, the real cost per loaded mile for many fleets now sits between 2.70 and 2.90 dollars. Fleets actively managing routing, fuel, idle time, and maintenance are holding their cost per loaded mile 12 to 20 percent below the industry average.
Why Cost Per Mile Isn't the Whole Story
Most fleets track cost per mile, but that figure is usually calculated against every mile the truck drives, loaded or empty. The problem is that empty miles don't generate revenue, yet they still burn fuel, wear tires, and accumulate engine hours. Cost per loaded mile takes your total operating cost and divides it only by the miles that actually earned you money. It is a harder number to look at, but it is the one that tells you the truth about your margins.
Think of it this way. If your truck drives 100,000 miles a year but 17,000 of those are deadhead miles between loads, your real cost has to be recovered across only 83,000 paying miles. That single gap between total miles and loaded miles can turn a truck that looks profitable on paper into one that is barely breaking even. Fleets that want to protect margins in 2026 need to sign up for FleetRabbit and start measuring this number honestly instead of guessing at it.
The Four Levers That Move Cost Per Loaded Mile
Four operational areas account for most of the swing between a high-cost fleet and a lean one: route and load planning, fuel management, idle and detention time, and maintenance discipline. Each one compounds the others, so a weakness in one area quietly drags down performance everywhere else.
FleetRabbit pulls fuel, maintenance, routing, and idle data into one dashboard so you can see your true cost per loaded mile instead of estimating it. Fleet managers who switch to data-driven benchmarking typically find 12 to 20 percent in recoverable margin within the first quarter.
Breaking Down the 2026 Cost Per Mile Components
Understanding where every cent of your cost per loaded mile actually goes makes it possible to target the right fix instead of cutting costs blindly. The table below lays out the major categories, roughly where they sit industry wide, and the direction each one has moved recently.
| Cost Category | Approx. Share of Total Cost | 2025-2026 Trend | Primary Lever |
|---|---|---|---|
| Driver Compensation | Largest single category | Rising steadily with benefits and retention pressure | Retention and route efficiency to protect driver hours |
| Fuel | Roughly a fifth of total cost | Holding relatively steady near 0.48 dollars per mile | Route optimization and idle reduction |
| Repair and Maintenance | Growing fastest of all categories | Up sharply year over year | Predictive maintenance and inspection discipline |
| Truck and Trailer Payments | Significant fixed cost | At record highs due to equipment pricing | Asset utilization and lifecycle planning |
| Tolls and Permits | Smaller but fast growing | Among the steepest percentage increases in 2025 | Route planning around high-toll corridors |
| Insurance | Rising pressure point | Increasing into early 2026 | Safety scores and claims history management |
Regional Cost Differences Fleet Managers Should Plan Around
Operating cost is not the same everywhere. Fleets running in the Northeast typically carry the highest per-mile cost due to tolls, congestion, and insurance rates, while fleets operating through the South Central region tend to see the lowest per-mile costs. If your lanes cross multiple regions, your cost per loaded mile should be calculated by lane, not as a single fleet-wide average, or you risk pricing loads incorrectly in your most expensive corridors.
Reducing Empty Miles Without Chasing Every Load
The instinct when margins tighten is to chase every available load, but that often increases deadhead miles rather than reducing them. A smarter approach pairs backhaul planning software with realistic driver home-time windows, so loaded miles increase without burning out drivers or adding unnecessary detours. Fleets using automated load and route matching typically reduce empty miles by several percentage points within the first two quarters of use.
A Simple Way to Check Your Own Number
Pull your total operating cost for the last quarter, then divide it by loaded miles only rather than total miles. Compare that figure against your revenue per loaded mile for the same period. If the gap is thin or negative on certain lanes, that lane is quietly working against your fleet even if the truck looks busy on paper.
Maintenance Planning as a Cost Per Mile Strategy
Repair and maintenance spending grew faster than almost any other cost category in 2025, and unplanned repairs are the most expensive version of that spend. A truck sitting in an unscheduled repair bay is not just costing you a repair bill, it is producing zero loaded miles for every hour it sits there. Moving toward scheduled, condition-based maintenance keeps trucks earning instead of waiting, and it converts an unpredictable expense into a manageable, budgeted one.
Fleets that pair maintenance data with route and fuel data get the clearest possible view of true cost per loaded mile, because every input feeds the same number instead of living in separate spreadsheets. If your maintenance records, fuel cards, and dispatch software are not talking to each other, you are almost certainly underestimating your real cost per loaded mile right now.
Turning Data Into a Repeatable Process
The fleets holding cost per loaded mile below industry average are not doing anything exotic. They review the number weekly, they know which lanes and which trucks are dragging the average down, and they act on that information before it becomes a quarterly surprise. Building this rhythm is far easier with a platform that automatically pulls fuel, maintenance, and route data into one place rather than trying to reconcile it manually every month.
FleetRabbit automates the data pull across fuel, maintenance, routing, and idle time so your cost per loaded mile updates itself every week. Fleet managers spend less time in spreadsheets and more time acting on what the numbers actually show.
Cost per loaded mile is not a vanity metric, it is the number that decides whether 2026 is a profitable year or a survival year for your fleet. The fleets pulling ahead right now are the ones treating fuel, routing, idle time, and maintenance as one connected system instead of four separate problems. Getting there does not require a massive overhaul, it starts with visibility into the real number behind every load you haul.
FleetRabbit connects your fuel, maintenance, and routing data so you always know your true cost per loaded mile, lane by lane and truck by truck. Get started free with up to 3 vehicles, no credit card required.







