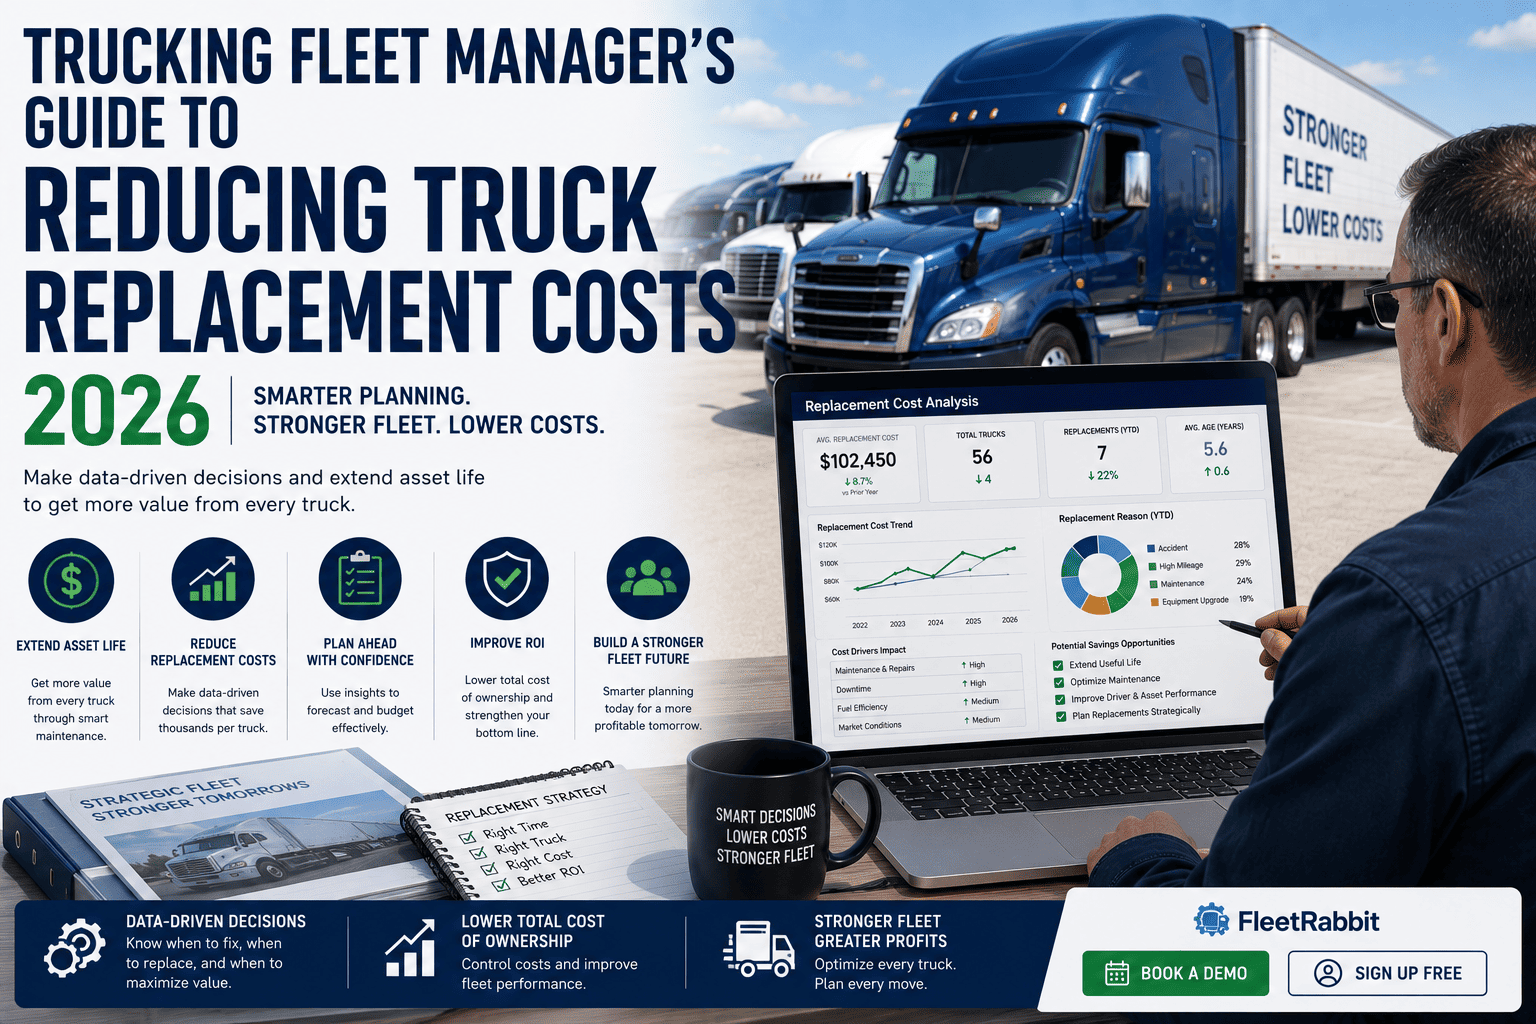
Every truck in your fleet is quietly telling you when it's time to let it go. The trouble is that most fleet managers only hear the message once it's shouting, after the third breakdown in a month or a transmission rebuild bigger than the truck's own resale value. Replacement decisions made on gut feel or an arbitrary age limit almost always cost more than decisions made on data, because the real inflection point where a vehicle stops being an asset and starts being a liability isn't the same for every truck, every route, or every duty cycle. Getting that timing right is one of the highest-leverage financial decisions a fleet manager makes all year.
Vehicles over 10 years old commonly cost around 1.10 dollars per mile to maintain, compared to roughly 0.15 to 0.20 dollars per mile for trucks in the 6 to 10 year range. Maintenance costs tend to climb sharply after year 7, rising 25 to 30 percent annually from there. A widely used rule of thumb says replacement makes financial sense once repair costs exceed 40 percent of a vehicle's current value, and delaying that decision by even a year or two can cost tens of thousands of dollars per truck once downtime and resale loss are counted.
Why The "Sweet Spot" Matters More Than A Fixed Age Rule
A lot of fleets still replace vehicles on a fixed schedule, seven years no matter what, or once odometer hits a round number. That approach ignores the fact that total cost of ownership isn't a straight line. Depreciation is steepest in the first three years, then flattens out, while maintenance cost does the opposite, staying low early on and then climbing fast once a truck passes the seven to eight year mark. The sweet spot is the point where those two curves cross, where the vehicle has shed most of its depreciation but hasn't yet started bleeding money in repairs.
The Depreciation Curve
Depreciation typically accounts for a large share of total ownership cost, with the steepest drop happening in a truck's first three years on the road. After that early drop, resale value declines much more gradually, which is exactly why the sweet spot for replacement usually sits well before a truck becomes fully depreciated.
The Maintenance Cost Curve
Maintenance cost per mile moves in the opposite direction. It stays relatively flat and low for the first several years, then begins climbing noticeably around year seven, and from there the increase compounds year over year as more components reach the end of their service life at roughly the same time.
Where The Curves Cross
For most medium and heavy-duty trucks, that crossover point lands somewhere between year six and year ten, depending on duty cycle, route type, and how aggressively the vehicle has been maintained. Tracking your own fleet's numbers instead of relying on an industry average is what turns this from a guess into a defensible plan.
FleetRabbit tracks cost per mile by individual vehicle age automatically, so you can see exactly where your fleet's depreciation and maintenance curves cross. You can sign up here to see your own fleet's lifecycle data, or book a demo to walk through a replacement case with our team.
What Total Cost Of Ownership Actually Includes
A purchase price or a monthly lease payment is only the visible part of what a truck actually costs. A full total cost of ownership view pulls in every category so a replacement decision is based on the complete picture, not just the line items that happen to show up on an invoice.
| Cost Category | What It Includes | Why It's Often Missed |
|---|---|---|
| Depreciation | Loss of resale value over time, steepest in the first three years of ownership | Feels like a paper loss instead of a real cost since no invoice is generated |
| Maintenance & Repair | Scheduled service plus unplanned repairs, which accelerate sharply after year seven | Tracked per repair instead of per mile, hiding the trend until costs are already high |
| Downtime Value | Lost revenue and schedule disruption while an aging vehicle sits in the shop | Rarely shows up on a maintenance invoice even though it's a real financial loss |
| Financing & Insurance | Loan or lease payments plus insurance premiums tied to the vehicle | Treated as fixed and rarely re-evaluated against a replacement's total cost |
| Resale Value | What the vehicle can still be sold or traded for at the point of replacement | Declines further the longer a fleet waits, quietly shrinking the return on disposal |
Signs A Truck Has Crossed Into Replacement Territory
Waiting for a truck to strand a driver on the roadside is the most expensive way to make a replacement decision. A handful of measurable signals usually show up well before that point.
The 40 Percent Rule
When repair costs on a single vehicle exceed roughly 40 percent of what that vehicle is currently worth, replacement is almost always the better financial move, even if the truck is technically still driveable.
Repeat Failures On Major Systems
A truck needing a third repair on the same system within six months is telling a very different story than one with a single unrelated failure. Repeat major component issues are a strong signal that the underlying system is at the end of its useful life.
Rising Unplanned Downtime
Older vehicles tend to accumulate far more unplanned downtime hours than newer ones in the fleet. When a specific truck's downtime hours start climbing well above the fleet average, it's usually a sign the vehicle has entered its cost-accelerating years.
Turning Signals Into A Business Case
None of these signals need to be a mystery if they're tracked consistently. Cost per mile by vehicle, downtime hours by vehicle, and repair frequency by system are the three numbers that turn "this truck feels old" into a data-backed replacement recommendation leadership can approve quickly.
FleetRabbit flags vehicles crossing the 40 percent repair-to-value threshold automatically and tracks downtime hours by vehicle so the data makes the case for you. Start free and connect your fleet today, or book a walkthrough to see a real replacement report.
Replacement Benchmarks By Vehicle Class
Industry benchmarks give a useful starting point, though your own duty cycle and route type should always be the final word.
Frequently Asked Questions
The Bottom Line On Truck Replacement Timing
The most expensive sentence in fleet management is still "the truck still runs." Every extra year past the point where maintenance costs overtake the value of keeping a vehicle is a year spent funding an asset's decline instead of investing in one that pays you back. The fleets getting this right aren't guessing or following an arbitrary age rule, they're tracking cost per mile by vehicle, watching for the 40 percent threshold, and making the replacement call while the truck still has resale value left to protect.
Every month a truck stays past its sweet spot is a month of margin quietly disappearing into repair bills and downtime. FleetRabbit tracks cost per mile, downtime, and repair-to-value ratio by vehicle automatically, so your next replacement decision is backed by data instead of a hunch. Sign up free and connect your first vehicles today, or book a short demo to see your own fleet's replacement timing mapped out.







