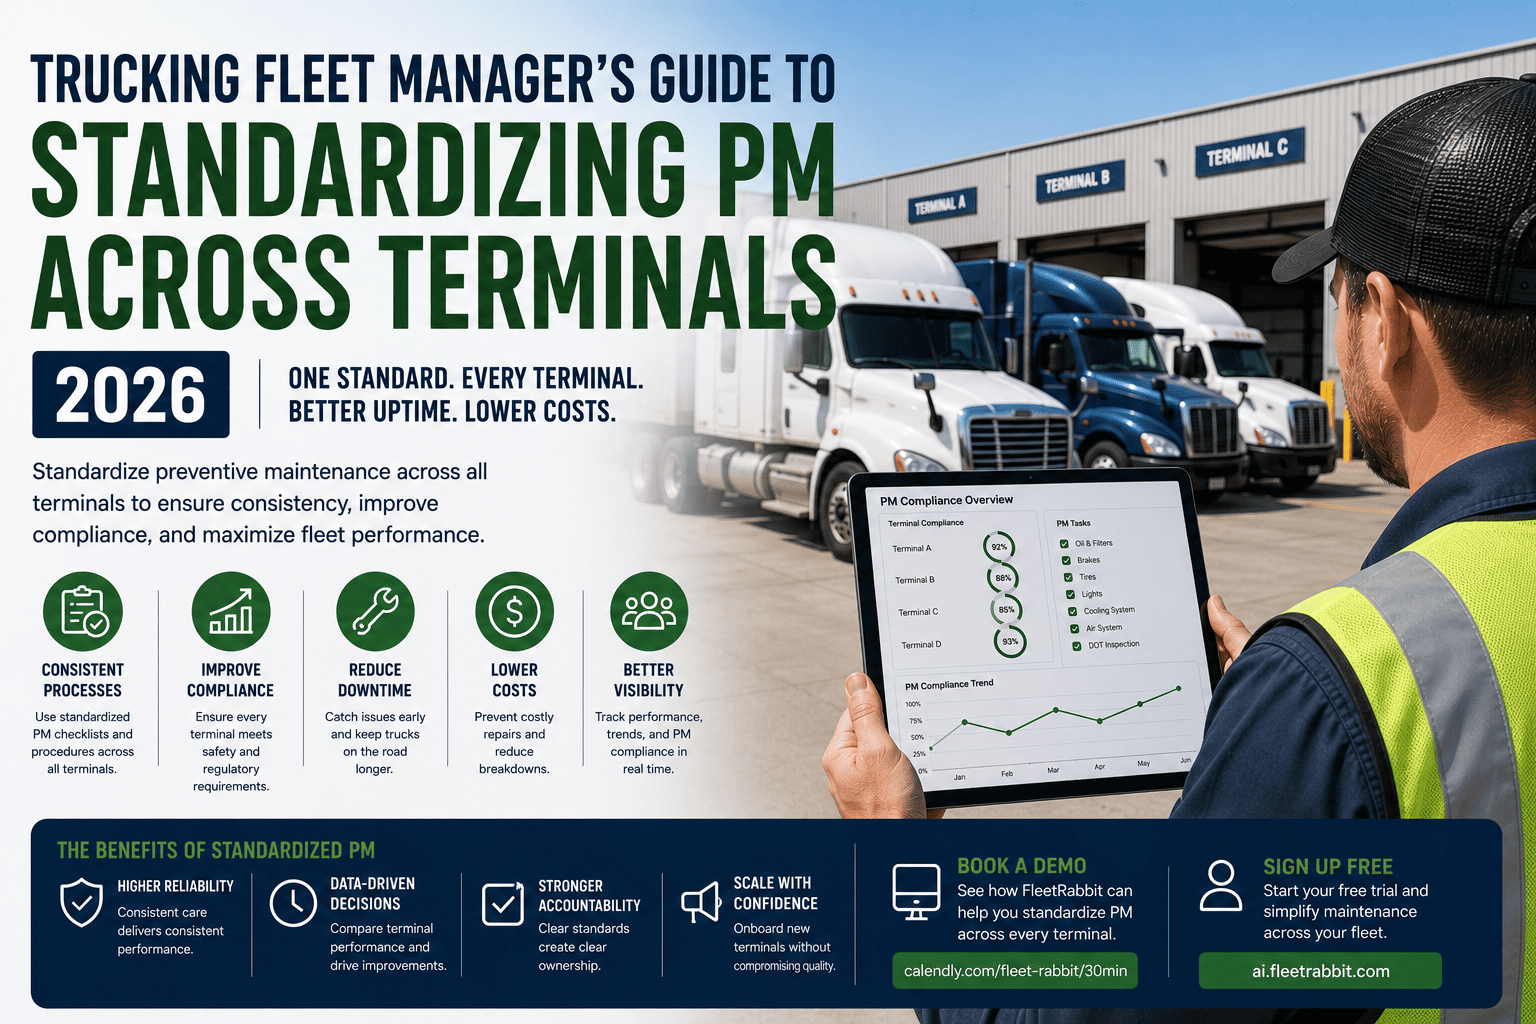
Ask three terminal managers in the same trucking company when they change oil, and you will likely get three different answers. One says every 5,000 miles, another says 8,000, and a third admits it depends on whoever remembers first. The trucks are identical, the routes are similar, yet the maintenance outcomes are not. This quiet drift between terminals is one of the most expensive and least visible problems in multi-location fleet operations, and it rarely shows up as a single obvious line item until someone compares the numbers side by side.
Fleets running identical vehicles across different locations see repair costs vary by 20 to 30 percent purely because maintenance intervals drift between terminals. Standardizing preventive maintenance schedules and checklists across every location cuts breakdowns by up to 45 percent and pushes on-time PM completion above 95 percent within a few months.
Why Inconsistent PM Costs More Than It Looks Like
A gap of just a couple thousand miles between how two terminals schedule the same service sounds minor, yet it compounds across an entire fleet year after year. One yard's trucks run leaner and last longer. Another's absorb more unplanned repairs, more towing calls, and more days sitting idle at a cost that regularly runs 760 to 1,200 dollars per truck per day. Multiply that gap across dozens of vehicles and several terminals, and the business is not just losing money, it is losing the ability to predict its own maintenance budget from one quarter to the next.
The deeper cost is cultural. When maintenance quality visibly differs between terminals, drivers notice immediately, and confidence in the shop erodes. A manager transferring from a disciplined terminal to a loose one has to relearn an entirely different set of unwritten rules. New hires get trained inconsistently because there is no single source of truth for what proper service actually looks like. Standardization fixes both the financial leak and the operational confusion in one move.
What A Standardized PM Framework Actually Includes
A real standardization effort is not just a memo asking everyone to try harder. It is a defined, written structure that every terminal is expected to follow the same way, regardless of who is running the yard that year.
Shared Service Intervals
Every vehicle of the same make, model, and duty cycle follows identical mileage, engine-hour, or time-based triggers, so a truck serviced in one city receives the exact same treatment as its twin in another state.
Identical Inspection Checklists
Digital checklists remove guesswork from what gets inspected during a PM visit, ensuring a brake check in one terminal covers the same points as a brake check three states away.
Consistent Approval And Escalation Rules
Repair approval thresholds and escalation paths stay the same everywhere, so a 2,000 dollar repair gets the same review process whether it happens at headquarters or the smallest satellite yard.
| Operating Model | How Maintenance Runs | Visibility For Leadership | Typical Result |
|---|---|---|---|
| Independent Terminals | Each yard sets its own intervals, checklists, and repair thresholds | Scattered spreadsheets, no shared reporting format | 20 to 30 percent cost variance between identical trucks |
| Loosely Coordinated | Head office issues guidelines, but enforcement varies by location | Periodic reports, several weeks out of date | Recurring issues rediscovered separately at each terminal |
| Fully Standardized | Shared intervals, digital checklists, and escalation rules across every terminal | Real-time dashboard comparing every location side by side | Up to 45 percent fewer breakdowns fleet-wide |
FleetRabbit centralizes PM schedules, digital checklists, and approval rules so every terminal follows the exact same maintenance standard, without losing local flexibility on the shop floor. Fleet managers ready to compare every location on one dashboard can start a free trial today.
Rolling Out Standardization Without Disrupting Operations
Terminal managers understandably resist change that feels imposed from a distance, especially when their current routine, however inconsistent, at least keeps trucks moving. The rollout works best as a phased process rather than a single company-wide switch flipped overnight.
Step One: Audit What Each Terminal Actually Does Today
Before writing a single new rule, document what each location currently does, including the undocumented habits that live only in a technician's head. This audit reveals exactly which practices deserve to become the new standard and which ones should be retired.
Step Two: Build One Shared Framework
Combine the best practices found across terminals into a single written standard covering service intervals, checklist content, parts stocking rules, and repair approval thresholds, so every location works from the same document instead of local memory.
Step Three: Roll Out Through A Central System
A shared digital platform pushes the same PM schedule and checklist to every terminal automatically, removing the burden of manually communicating updates across locations every time a policy changes.
Step Four: Track Compliance By Location
Ongoing dashboards showing PM completion rate, overdue services, and repeat repairs by terminal keep the standard alive long after the initial rollout excitement fades. Most fleets move from reactive habits to a fully operational standardized program within 60 to 90 days.
Metrics That Prove Standardization Is Working
Fleet leaders who want a clear, side-by-side view of these numbers across every terminal without building spreadsheets by hand can book a personalized demo and see exactly how their locations compare today.
Frequently Asked Questions
Stop letting maintenance quality depend on which terminal a truck happens to be parked at. FleetRabbit gives every location the same schedules, checklists, and compliance tracking, so leadership finally sees one consistent fleet instead of scattered yards. Start free and bring every terminal onto the same standard today.







