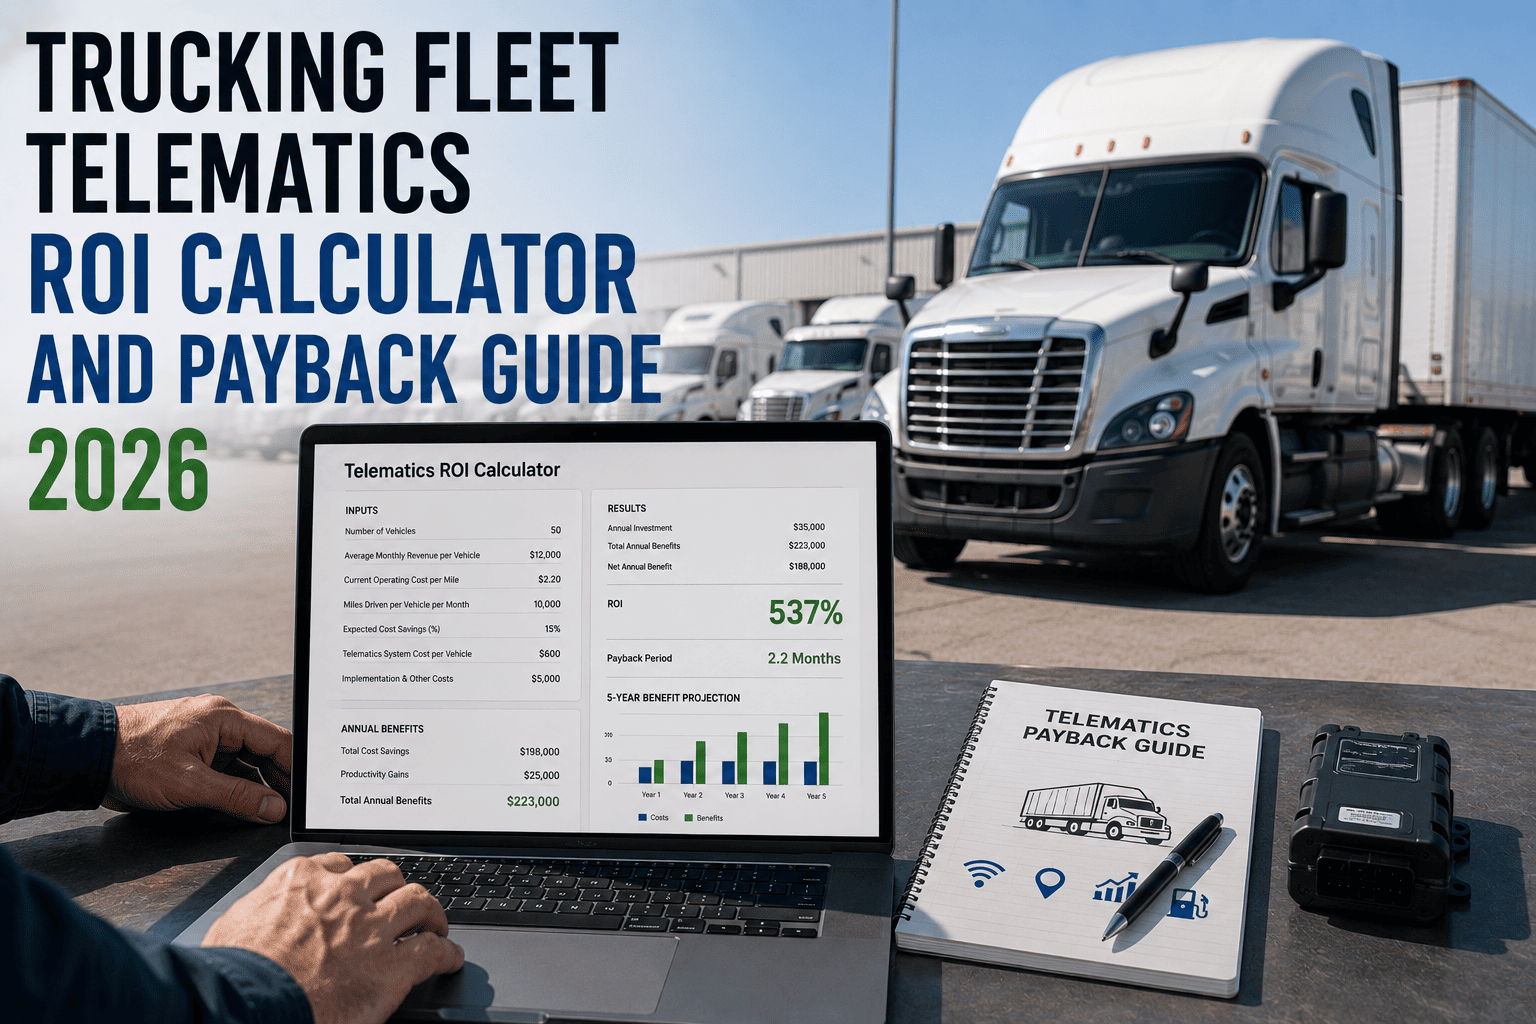
"What's the ROI on this?" is the question that kills more fleet technology proposals than any competitor ever could. Not because telematics doesn't pay off, but because most fleet managers walk into that meeting with a feature list instead of a number. The good news is the math behind telematics ROI isn't complicated once you know which categories to measure and how to calculate them. This guide breaks down the exact formula, the savings categories that matter, and realistic payback timelines so you can walk into that meeting with a number instead of a hope.
Telematics ROI = (Total Annual Savings minus Total Annual Cost) divided by Total Annual Cost, multiplied by 100. Most fleets see 200 to 700 percent ROI within the first year, with payback periods ranging from 2 to 8 weeks for fuel savings and up to 9 to 24 months for full system payback across fuel, maintenance, insurance, and compliance combined. Software-only platforms without hardware costs consistently deliver faster payback than hardware-dependent systems.
The ROI Formula Every Fleet Manager Should Know
Before running any numbers, it helps to see the calculation in its simplest form. This is the same formula finance teams use to evaluate any capital investment, applied specifically to fleet technology.
Why This Formula Convinces Leadership
Executives and CFOs respond to ROI projections far more consistently than they respond to feature lists. Framing the technology cost as a small percentage of total fleet operating cost, typically 0.5 to 1.5 percent, that reduces the other 98.5 percent by 10 to 25 percent is the argument that actually gets budget approved. If you haven't run the numbers for your own fleet yet, you can sign up for a free trial and let the platform track your baseline and savings automatically from day one.
ROI vs. Cost of Inaction
A complete business case includes more than projected savings, it also accounts for the cost of doing nothing. Unplanned downtime, missed maintenance intervals, and preventable accidents all carry hidden costs that continue accumulating whether or not a fleet invests in telematics. Comparing ROI against this cost of inaction, rather than against a zero baseline, makes the true financial case far more compelling.
FleetRabbit tracks your baseline costs and calculates projected savings automatically, so you walk into budget conversations with real numbers instead of estimates. Sign up for a free trial and see your fleet's ROI projection in minutes.
The Four Savings Categories That Drive ROI
Telematics ROI never comes from one place. It stacks across four distinct categories, each with its own timeline for when savings actually appear.
| Savings Category | Typical Improvement | When Savings Appear | Primary Driver |
|---|---|---|---|
| Fuel | 10 to 15 percent reduction | Immediately through route optimization | Idle reduction, route efficiency, driver behavior scoring |
| Maintenance | 18 to 25 percent reduction | Accumulates over 3 to 6 months | Preventive scheduling replacing reactive repairs |
| Insurance and Risk | 5 to 20 percent premium reduction | Applied at next policy renewal | Verified driver monitoring, dashcam coverage, fewer claims |
| Administrative Labor | 30 to 50 percent time freed up | Within 30 to 60 days | Automated timesheets, mileage reports, compliance documentation |
Fuel Savings: The Fastest Category to Materialize
With diesel prices averaging well over 4.50 dollars per gallon in 2026, fuel waste is the most immediate and visible line item telematics addresses. It is a common industry observation that roughly 10 percent of drivers are responsible for nearly half of all fuel waste through aggressive acceleration and excessive idling, which is exactly why driver behavior scoring delivers savings almost as soon as it is switched on.
Maintenance Savings: The Slower Build With the Bigger Payoff
Maintenance savings take longer to show up because preventive scheduling needs a few months of vehicle data before it starts catching issues early and consistently. Once it does, the payoff compounds, since every prevented breakdown avoids emergency repair premiums, towing, and lost revenue that a reactive maintenance approach would have absorbed in full.
Insurance: The Category Most Fleets Underestimate
Insurers increasingly reward documented safety data. Fleets with verified driver monitoring and dashcam coverage commonly secure 5 to 20 percent premium reductions, and video telematics also reduces exposure to fraudulent claims, which in some markets represents 10 to 20 percent of total claim costs. Because this savings only applies at renewal, it is often the last category to show up in a fleet's ROI tracking, even though it can be one of the largest.
Instead of estimating savings category by category, FleetRabbit reports actual performance across fuel, maintenance, and safety in one dashboard. Book a demo and see how the numbers add up for your specific fleet.
Payback Timelines by Fleet Size
Payback speed and total dollar impact scale differently depending on fleet size, which is why a single blanket number rarely tells the full story.
| Fleet Size | Vehicle Count | Typical Payback Period | ROI Characteristics |
|---|---|---|---|
| Small Fleet | 5 to 15 vehicles | 2 to 8 weeks for fuel savings | Percentage returns similar to larger fleets, lower absolute dollars |
| Medium Fleet | 25 to 100 vehicles | 5 to 7 weeks for initial payback | Often the highest ROI, since dedicated fleet staff usually isn't in place yet |
| Large Fleet | 100+ vehicles | 9 to 24 months for full system payback | Massive absolute savings even with lower percentage improvements, due to scale |
Why Medium Fleets Often See the Fastest Returns
Fleets in the 25 to 100 vehicle range frequently outperform both smaller and larger operations on ROI, not because the technology works differently for them, but because they typically have significant savings potential sitting untapped without yet having invested in dedicated fleet management staff to capture it manually. Telematics closes that gap almost immediately.
Frequently Asked Questions
Stop presenting feature lists and start presenting numbers. FleetRabbit tracks your baseline, calculates category-by-category savings, and shows exactly when your fleet reaches payback, so every budget conversation starts with data instead of guesswork. Start your free trial with no credit card required, or talk to our team about your specific fleet.







