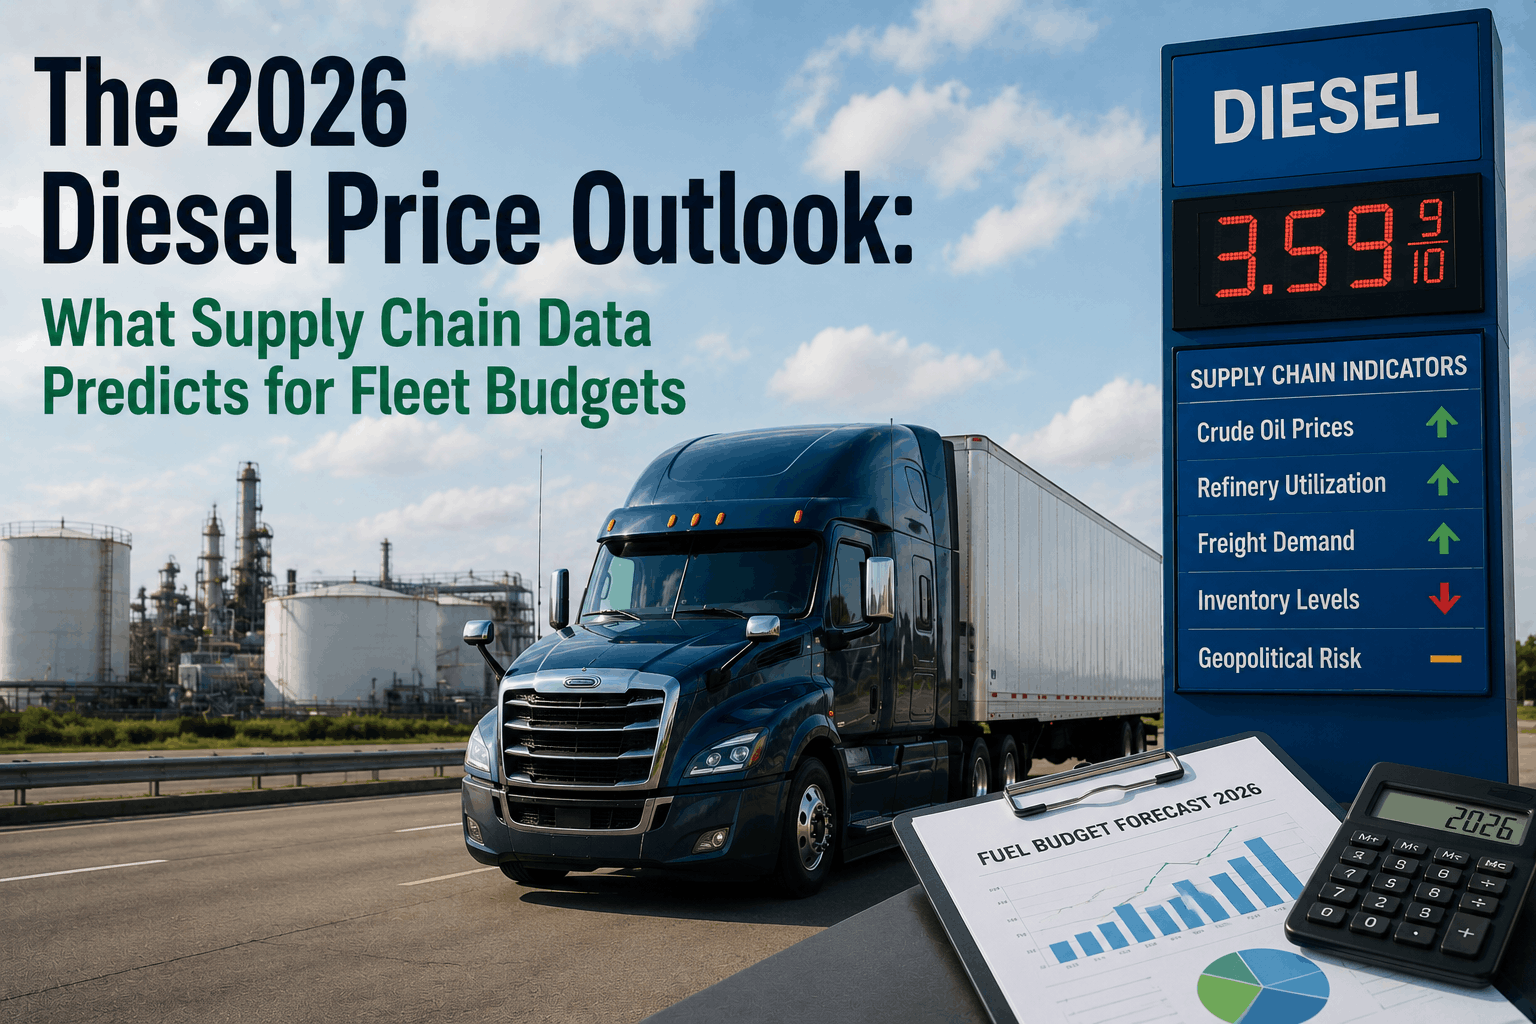
The 2026 Diesel Price Outlook: What Supply Chain Data Predicts for Fleet Budgets

diesel-price-forecast-outlook-supply-chain

Nobody in fleet management budgeted for $5.37 diesel. At the start of 2026, the Energy Information Administration was projecting a calm year — prices around $3.50 per gallon, easing inventories, and steady U.S. production at record highs. Then February 28 happened. The Strait of Hormuz, the narrow waterway that carries roughly 20% of the world's oil, effectively closed overnight. What followed has been the most disruptive diesel price environment in modern trucking history — and if your fleet budget was built on the old projections, it is already underwater. This article breaks down what supply chain data actually tells us about diesel in 2026, what the rest of the year looks like, and how smart fleet operators are protecting their margins right now.

2026 FUEL MARKET ANALYSIS

The 2026 Diesel Price Outlook: What Supply Chain Data Predicts for Fleet Budgets

From a projected calm year to a historic energy shock — the full picture fleet managers need

Diesel Forecast Fleet Fuel Budgeting Supply Chain Risk
$5.37 Peak national diesel avg, March 2026

55% Above EIA's original 2026 forecast

35–40% Of total fleet operating costs = fuel

The Year Diesel Was Supposed to Get Cheaper

Every major energy forecast entering 2026 pointed in the same direction: down. The EIA's December 2025 outlook projected U.S. diesel averaging $3.50 per gallon for the full year. Brent crude was forecast at $52 per barrel by late 2026. U.S. oil production was sitting at a record 13.5 million barrels per day. The math looked clean. Non-OPEC+ supply growth was outpacing demand, global inventories were building, and there was genuine expectation this would be the fourth consecutive year of lower diesel prices for American fleets.

Fleet operators who built Q1 budgets on those projections had reasonable grounds to do so. The data supported it. And then the Strait of Hormuz, the 21-mile-wide chokepoint through which nearly a quarter of the world's seaborne oil passes, shut down. Within a week of the February 28 disruption, diesel jumped 96 cents in a single week — the largest one-week increase in the benchmark's 32-year history. By late March, the national average had hit $5.37 per gallon. That is 55% above where the year was supposed to go. If you are managing a fleet right now, sign up on FleetRabbit to get real-time cost-per-mile visibility before that number climbs further.

WHAT THE EIA SAID VS REALITY
Dec 2025 Forecast $3.50/gal Full-year 2026 average
vs
March 2026 Reality $5.37/gal National average peak

The gap: $1.87/gallon. For a 50-truck fleet running 100k miles/year at 6.5 MPG, that is an extra $1.44 million in annual fuel spend versus budget.

Why This Spike Is Different From Previous Ones

Past diesel spikes were usually demand-driven or tied to short-term refinery disruptions. This one is structural — and that matters enormously for how long it lasts.

01

Strait of Hormuz Closure

The February 28 conflict effectively shut down one of the world's most critical oil corridors. Major carriers including Maersk, CMA CGM, MSC, and Hapag-Lloyd suspended transits. Over 150 tankers anchored outside the strait. The Strait handles roughly 20% of global seaborne oil — when it closed, a quarter of the world's oil supply was removed from accessible markets overnight. There is no alternative route that does not add 10 to 14 days and significant cost per voyage.

02

Red Sea Double-Block

At the same moment the Hormuz situation escalated, the Houthis reversed every fragile gain made since the October 2025 ceasefire and resumed attacks on Red Sea shipping. For the first time in modern history, both of the Middle East's major maritime corridors are simultaneously disrupted. The Red Sea route to Europe is operating at under 50% of pre-crisis capacity.

03

Refinery Capacity Squeeze

Even before the Hormuz disruption, diesel refining capacity was already constrained. Several regional refinery closures and conversions have tightened U.S. diesel supply margins. Refiner margins (crack spreads) were expected to rise in 2026, and now under the supply shock, that pressure is compounding on the retail pump price that fleet managers pay.

04

Seasonal Demand Stacking

Q2 brings agricultural planting season, construction activity, and peak freight movement — all diesel-intensive. These demand cycles are layering on top of the supply disruption rather than offsetting it. Analysts are projecting Q2 diesel prices to range between $4.30 and $4.90 per gallon in most U.S. regions, with continued volatility through Q3.

2026 Diesel Price Timeline: Quarter by Quarter

Here is how the year is shaping up based on current supply chain data and analyst projections — and what each quarter means for fleet budget planning.

Q1 2026
$3.52 – $5.37
Started near EIA forecast of $3.52/gal. Hormuz disruption hit late February, spiking to $5.37 by late March. Largest single-week jump in benchmark history (+$0.96 in one week).
Q2 2026
$4.30 – $4.90
Elevated range driven by seasonal demand + continued Hormuz restrictions. Fuel surcharges tightening carrier margins. Contract freight shippers absorbing higher rates. Budget planning should target the top of this range.
Q3 2026
$3.80 – $4.50
Possible stabilization if Hormuz situation improves and Middle Eastern producers ramp production. EIA's April outlook offers cautious hope for easing. Any return to disruption would push this range back up rapidly.
Q4 2026
$3.50 – $4.20
Seasonal demand softens. If global supply chains normalize, Q4 could see partial reversion toward original EIA forecasts. Structural refinery constraints remain a floor. Plan conservatively — oil at $100/bbl is being projected through late 2026.

BUILT FOR MOMENTS LIKE THIS

Your Fleet Budget Is Being Rewritten Every Week

FleetRabbit gives fleet managers real-time cost-per-mile tracking, fuel consumption monitoring, and maintenance cost visibility — so when diesel spikes, you see the impact immediately and can act on it. No spreadsheets. No guesswork.

Sign Up Free Book a Demo

No credit card. See your fleet's fuel numbers in minutes.

What This Actually Costs Your Fleet

Translating price-per-gallon into real budget impact depends on fleet size and mileage. Here is what the current diesel environment means in concrete dollar terms — based on Class 8 trucks averaging 6.5 MPG at 100,000 miles per year.

Fleet Size At $3.50/gal (original forecast) At $4.80/gal (current EIA revised avg) Additional Annual Cost
5 Trucks $269,230 $369,230 +$100,000
15 Trucks $807,692 $1,107,692 +$300,000
30 Trucks $1,615,384 $2,215,384 +$600,000
50 Trucks $2,692,307 $3,692,307 +$1,000,000
Based on 100,000 miles/truck/year, 6.5 MPG average. Actual results vary by route, load, and driver behavior.

That additional cost column is not an abstract number — it represents the difference between a profitable year and a margin crisis. For a 30-truck fleet, $600,000 in unexpected fuel spend is real capital that was earmarked for equipment upgrades, driver pay improvements, or reserve. The fleets that survive this environment are the ones tracking their actual fuel spend in real time, not reconciling it at month-end. If you are not already monitoring cost per mile weekly, sign up on FleetRabbit and get that visibility today — before Q2 pushes these numbers higher.

Five Operational Moves That Protect Margins Now

1

Track Actual vs. Budgeted Fuel Weekly

Monthly reconciliation is too slow at current volatility. Fleets reviewing fuel spend weekly can catch overconsumption by driver, route, or vehicle before it compounds. The difference between weekly and monthly visibility at current prices can be tens of thousands of dollars per month for mid-size fleets.

2

Audit Idle Time Immediately

Excessive engine idling is the easiest fuel cost to eliminate without touching routes or loads. At $4.80 diesel, a truck idling one extra hour per day burns approximately $1.50 to $2.00 in fuel — across a 30-truck fleet, that is over $16,000 per month in recoverable cost. Idle monitoring pays for itself in weeks at current prices.

3

Prioritize Preventive Maintenance on Fuel Systems

Worn injectors, clogged DPF systems, and underinflated tires all increase fuel consumption. At $3.50 diesel, deferred maintenance had modest fuel-cost consequences. At $5.00 diesel, the same deferral compounds every inefficiency. A truck running 3% above optimal fuel consumption costs an extra $4,500 per year at current prices.

4

Review Fuel Surcharge Structures With Customers

Many fleet operators are locked into fuel surcharge structures that were calibrated for a $3.50 to $4.00 diesel environment. At $5.00-plus, those structures no longer protect margins. Proactive customer conversations backed by EIA data give fleet managers a credible basis for renegotiation — and the data is clearly in their favor right now.

5

Identify Your Most and Least Fuel-Efficient Units

At elevated diesel prices, the gap between your best and worst performing trucks widens dramatically. A truck averaging 5.8 MPG versus 7.2 MPG represents a 24% fuel cost difference per mile. Identifying underperforming vehicles — whether through age, spec, or maintenance — and prioritizing them for replacement or service becomes a high-ROI decision when diesel is expensive. You can book a demo with FleetRabbit to see how per-vehicle fuel tracking works in practice.

What Could Push Prices Lower


Hormuz Reopening

If the current conflict resolves and the Strait reopens to commercial traffic, Middle Eastern producers could ramp output rapidly. The EIA's April outlook projects this as the most likely path to Q3 and Q4 relief. However, industry experts warn that even after hostilities end, logistical normalization could take six months or more.


U.S. Production at Record Levels

Domestic crude at 13.5 million barrels per day provides a meaningful buffer. U.S.-sourced diesel supply is less directly exposed to Hormuz than globally-sourced alternatives, which partially moderates the worst-case scenarios for domestic fleet operators.


Demand Moderation

If freight volumes soften in response to broader economic slowdown — which some analysts project given stagflation signals — demand-side pressure on diesel could ease even before supply normalizes. This is the less favorable scenario for the freight industry overall, but it would reduce diesel price pressure.

What Could Push Prices Higher


Sustained Hormuz Closure

If the conflict extends through Q3, oil at $100 per barrel could persist through late 2026 — consistent with current stagflation projections. Analysts warn that if diesel sustains above $6 per gallon, between 6,000 and 10,000 small carriers could exit the market, tightening capacity and pushing rates even higher. Sign up on FleetRabbit to stay ahead of capacity shifts before they impact your rates.


Refinery Constraint

Diesel-specific refining capacity is structurally tighter than gasoline. Even if crude prices moderate, refiner crack spreads (and therefore the gap between crude and pump price) are expected to remain elevated through 2026. The price floor for diesel is higher than the crude price alone implies.


Additional Geopolitical Disruption

With both the Red Sea and the Strait of Hormuz disrupted simultaneously for the first time in modern history, any additional shock to Middle Eastern energy infrastructure has an amplified effect. The margin for further disruption is essentially zero — oil markets are already stretched, and any new escalation would transmit to diesel pump prices within days.

FLEET MANAGEMENT THAT ADAPTS

Stop Reacting to Diesel Prices. Start Managing Around Them.

FleetRabbit gives you the operational data to protect margins regardless of where diesel goes next. Track fuel consumption per vehicle, monitor idle time, log maintenance intervals, and see your real cost per mile — all in one platform built for commercial fleet operators. The fleets that emerge from 2026 in better shape are the ones controlling what they can control. That starts with visibility.

Sign Up Free Book a Demo

No commitment required. Works for fleets of any size.

Diesel Price Questions Fleet Managers Are Asking

What is the current national average diesel price in the United States?
As of early Q2 2026, the national average for on-highway diesel has been ranging between $4.20 and $5.38 per gallon depending on the specific date and region. The February 2026 average was $3.72/gallon before the Hormuz disruption; by late March it had surged to $5.37/gallon — the peak driven by the Strait of Hormuz crisis. Prices have remained elevated through Q2, with the EIA revising its full-year 2026 average projection to approximately $4.80/gallon due to continued supply tightness.
Why did diesel prices spike so sharply in early 2026?
The primary driver is the Strait of Hormuz disruption that began February 28, 2026. The Strait carries roughly 20% of the world's seaborne oil. When conflict effectively shut it down, major shipping carriers suspended transits and over 150 tankers anchored outside the passage rather than risk transit. Simultaneously, Houthi attacks resumed on Red Sea shipping, meaning both of the Middle East's major maritime oil corridors are disrupted at the same time — a situation with no modern precedent. Diesel jumped 96 cents in a single week, the largest one-week move in 32 years of benchmark data.
What was the EIA's original diesel forecast for 2026 and how accurate has it been?
The EIA's December 2025 Short-Term Energy Outlook projected diesel would average $3.50 per gallon for full-year 2026 — the fourth consecutive year of lower diesel prices. That forecast has been overtaken by the Hormuz disruption, with actual prices running roughly 55% above forecast at the Q1 peak. The EIA has since revised its 2026 average estimate upward to approximately $4.80/gallon, but this projection itself carries significant uncertainty tied to when or whether the Hormuz situation normalizes.
What percentage of fleet operating costs does diesel represent?
For commercial trucking fleets, fuel — primarily diesel — typically represents 30% to 40% of total operating costs under normal price conditions. At elevated prices like the $5.00-plus range seen in March 2026, that share rises further. Only driver compensation consistently ranks higher as a cost line in fleet operations. This is why diesel volatility creates margin crises for operators much more rapidly than price movements in most other industries.
Will diesel prices come down in the second half of 2026?
The consensus forecast is that Q3 and Q4 could see some easing if the Hormuz situation normalizes — potentially bringing prices back toward the $3.50 to $4.20 range. However, most analysts and the ITS Logistics April Supply Chain Report suggest planning for oil prices close to $100/barrel through late 2026. The structural refinery capacity constraints that existed before the disruption remain in place, providing a higher floor than the crude price alone would suggest. Planning for sustained elevation through at least Q2 and hedging Q3 is the conservative and defensible position for fleet budget managers.
How can fleet managers protect margins when diesel prices are this volatile?
The practical answer is operational visibility and consumption control. Fleets that track actual fuel spend per vehicle, monitor idle time, maintain preventive service schedules (especially on fuel systems and DPF), and review fuel surcharge structures with customers are best positioned to absorb price shocks without margin collapse. Technology platforms that provide real-time cost-per-mile data allow fleet managers to identify waste and respond to price changes faster than operators relying on monthly reporting. You can explore how FleetRabbit supports this type of visibility by booking a demo at calendly.com/fleet-rabbit/30min or signing up directly at ai.fleetrabbit.com.
What happens to small trucking carriers if diesel stays above $5 per gallon?
Industry analysts warn that if diesel sustains above $6 per gallon, an estimated 6,000 to 10,000 carriers — mostly small operators — could exit the market in 2026. Even at $5 per gallon, owner-operators without fuel surcharge protection in their contracts face significant cash-flow pressure. The result of widespread small carrier exits would be tighter trucking capacity in the second half of 2026, which would paradoxically push freight rates higher even after crude prices eventually moderate. Large fleets with fuel-efficient equipment, hedging capabilities, and strong data visibility are best positioned to capture market share during and after the current disruption.
June 11, 2026 By Erina
All Articles

The 2026 Diesel Price Outlook: What Supply Chain Data Predicts for Fleet Budgets

best-diesel-price-forecast-outlook-supply-chain

Diesel prices have become the most unpredictable variable in fleet budgeting. Geopolitical shocks sent crude oil surging above $115 per barrel in early 2026, forcing retail fuel hikes that directly impact freight costs. As we move through the year, fleet managers face a volatile outlook shaped by fragile peace deals, supply chain disruptions, and long-term energy transitions. Understanding what the data predicts is essential for protecting your fleet's bottom line in the months ahead.

The 2026 Diesel Price Outlook: What Supply Chain Data Predicts for Fleet Budgets

Current Brent Crude $115+ per barrel (post-crisis peak)
Under-Recovery ₹610Cr daily OMC losses on fuel sales
Required Increase ₹5/L additional petrol/diesel hike needed
Freight Exposure 42% fuel cost of road transport ops
Most Likely Outlook
$2.00/L
Petrol below $2 by early 2027, diesel below $2 by mid-2027
Normalization Path
Adverse Scenario
$3.07/L
Diesel at $3.07/L by end of 2026 if Strait reopening stalls
Strait Blockage Scenario
Optimistic Scenario
-10%
International diesel prices down 10% on peace deal relief
Peace Dividend

The Current Fuel Crisis: What's Driving Prices Up

Three major factors are converging to push diesel prices higher. First, geopolitical shocks have disrupted global supply chains. The Strait of Hormuz closure sent Brent crude above $115 per barrel in early 2026, with shipping reroutes adding distance, fuel burn, and cost at every step . Second, Indian oil marketing companies (OMCs) are incurring daily under-recoveries of approximately ₹610 crore, losing around ₹5.50 per litre on petrol and ₹4.50 per litre on diesel . Third, cumulative retail price hikes of about ₹7.50 per litre since May 15, 2026, have still not brought OMCs to break-even.

Direct Cost Impact on Supply Chains
CPI Inflation Impact 36-48 basis points From current cumulative price hikes
Food Price Transmission Dairy, fruit, pulses Categories most exposed to freight cost increases
Small Fleet Impact £300-£800/month Added costs for a typical small fleet

The Peace Dividend: Recent Relief and Projections

The US-Iran peace deal and reopening of the Strait of Hormuz have created a window for price relief. Philippine diesel prices could plunge by ₱7 to ₱9 per litre as geopolitical risk premiums evaporate . In Ghana, petrol prices are projected to decline by 9.3% while diesel falls by 1.7% due to sharp declines in international refined product prices — the steepest since the beginning of 2026 .

However, the relief is uneven. Diesel price declines are more modest because of the removal of government-industry intervention mechanisms in some markets. Refined product prices on the international market saw LPG decline by 19.94%, petrol by 15.21%, but diesel only by 10.17% . The peace dividend is real but partial.

To track how these global price movements affect your local fuel costs, sign up with FleetRabbit and access our real-time fuel price monitoring tools.

Westpac's Forecast: Three Scenarios for 2026

Westpac's economic analysis provides a structured framework for understanding diesel price trajectories through 2026. The bank identifies three distinct scenarios with significant implications for fleet budgets.

Most Likely
Oil prices normalize by end of 2027. Petrol falls below $2/L in early 2027, diesel below $2/L by mid-2027. Headline inflation eases to 4.2% by end of 2026 under faster rebound scenario.
Adverse Scenario
Only 30-40% of ships return to the Strait of Hormuz. Oil exceeds 2008 peak of US$150/barrel. Diesel hits $3.07/L, petrol $2.68/L by end of 2026. Headline inflation approaches 6% by Christmas.
Faster Rebound
Lower energy prices knock about 0.5 percentage points off Australia's headline inflation rate to 4.2% by end of 2026.

The Long-Term Transition: BNEF's Outlook

BloombergNEF's New Energy Outlook 2026 reveals that recent energy market shocks could accelerate the energy transition as countries look to decouple from imported fossil fuels. Solar will become the world's single largest source of electricity by 2032, driven by oversupply, technology advances, and falling prices . By 2035, some 11% of megawatt-hours generated will be shifted, up from 3% today .

The implications for fleet operators are clear: while diesel prices remain volatile, the long-term trend points toward electrification and reduced fossil fuel dependence. Asian economies with high import liabilities — Vietnam, Japan, Indonesia, and India — have the most to gain as they reduce their economic exposure to energy commodity imports.

Actionable Strategies for Fleet Operators

With volatility likely to persist, fleet operators should focus on what they can control. Cost visibility is the first step. Most small fleet operators have a rough idea of vehicle costs, not an accurate one, and until you know the real number, you cannot manage it. Preventive maintenance is an insurance policy against much larger breakdown costs, and service on time is almost always cheaper than a breakdown out of nowhere.

Fleets should use buying groups to negotiate better fuel prices, and leverage fuel timing strategies to purchase when prices are lower. Reducing the cognitive load of vehicle admin — MOT dates, service intervals, renewal deadlines — through digital tracking systems helps prevent costly oversights. To implement these strategies at scale, book a demo with FleetRabbit and explore our fleet cost optimization tools.

Protect Your Fleet Budget from Fuel Volatility

FleetRabbit's fuel management platform helps you track consumption, optimize routes, and negotiate better prices — all from a single dashboard.

Frequently Asked Questions

What is the most likely diesel price forecast for 2026?
The most likely forecast shows oil prices normalizing by the end of 2027, with petrol falling below $2 per litre in early 2027 and diesel falling below $2 per litre by mid-2027.
How much have fuel prices increased in 2026 so far?
Petrol and diesel prices have increased by about ₹7.50 per litre since May 15, 2026, with cumulative hikes potentially moving closer to ₹10 per litre in the near term .
What is the adverse scenario for diesel prices?
If only 30-40% of ships return to the Strait of Hormuz, oil could exceed US$150 per barrel, driving Australian diesel prices to $3.07 per litre by the end of 2026 .
How do fuel price hikes affect inflation and supply chains?
A ₹7.50 per litre increase adds approximately 36 basis points to consumer inflation, while a cumulative ₹10 per litre hike could add 48 basis points. Food categories reliant on logistics — dairy, fruits, pulses — are most exposed to higher freight costs .
What can fleet operators do to mitigate fuel cost increases?
Fleet operators can improve cost visibility through digital tracking, implement preventive maintenance to avoid costly breakdowns, join collective buying groups for better fuel and parts pricing, and use fuel timing strategies to purchase when prices are lower .

Take Control of Your Fuel Costs with FleetRabbit

From real-time fuel price tracking to route optimization and bulk buying, FleetRabbit gives you the tools to navigate diesel price volatility. Sign up with FleetRabbit and start saving on fuel today.

June 19, 2026 By Edward
All Articles

Share This Story, Choose Your Platform!

Latest Articles

Scroll