The question every fleet manager running diesel trucks eventually faces is no longer "should we consider electric?" — it is "when does electric make financial sense for our specific operation, and what does the math actually look like over five years?" The answer depends on variables that generic industry projections rarely capture: your average daily route mileage, your regional electricity pricing, the duty cycle intensity of your trucks, your access to charging infrastructure, and — critically — the incentive programs available in your state and jurisdiction. This article builds a detailed, grounded five-year total cost of ownership (TCO) projection for a 25-truck medium-duty fleet transitioning from diesel to battery-electric, using current verified data on vehicle pricing, fuel costs, maintenance savings, charging infrastructure, and available incentives.
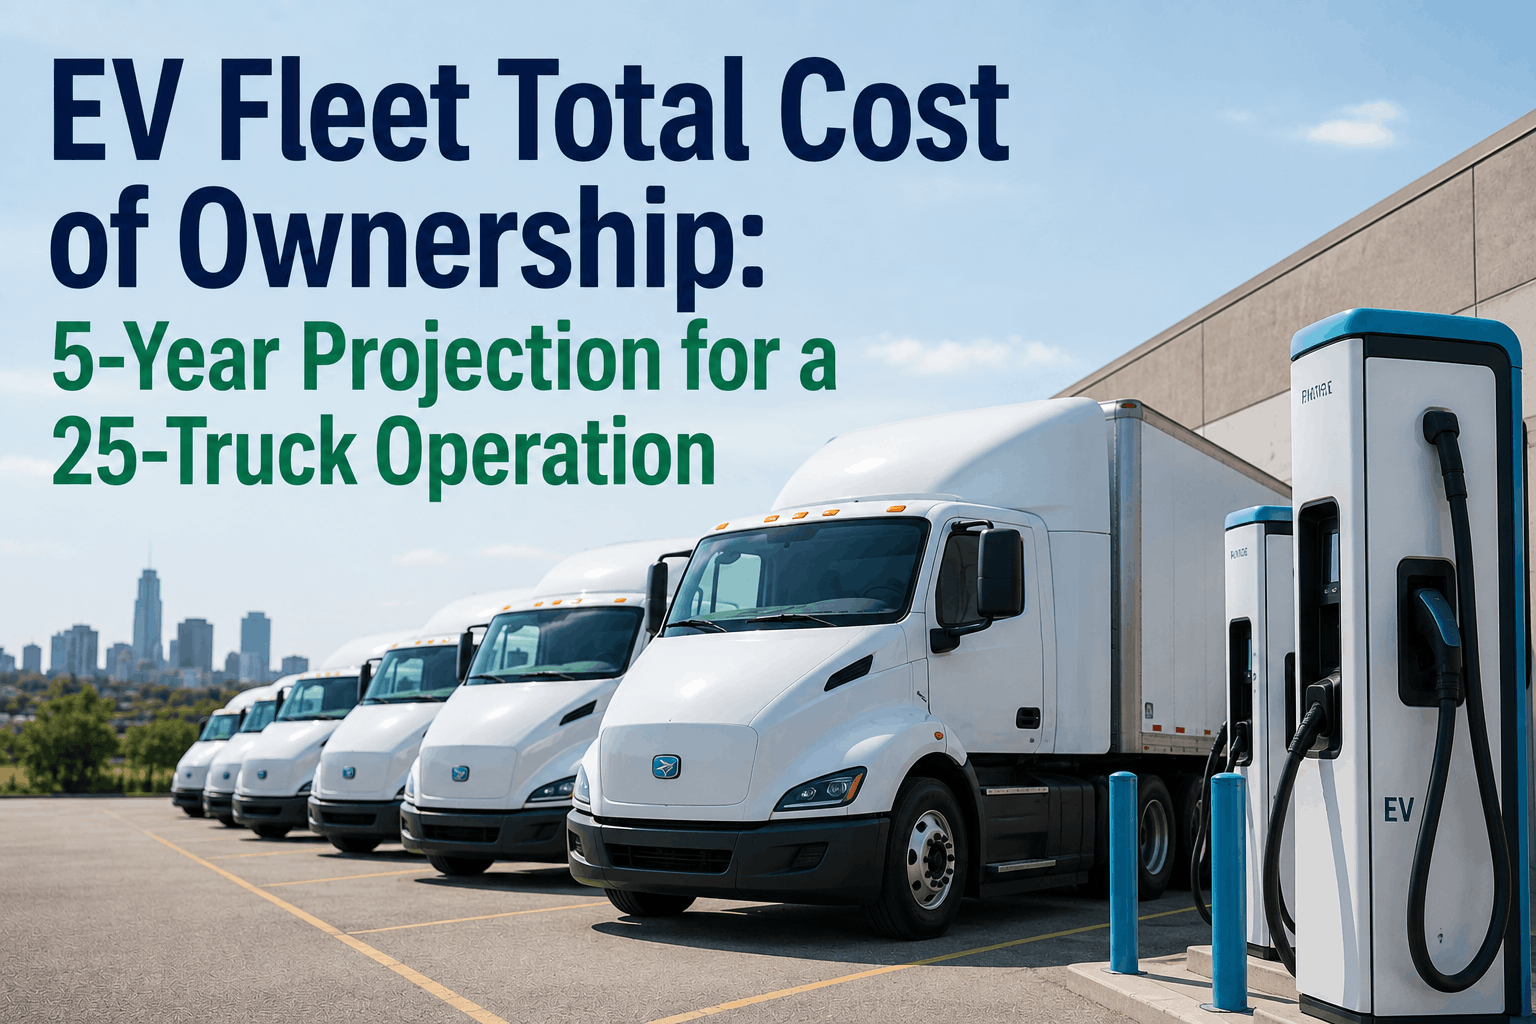
EV Fleet Total Cost of Ownership: 5-Year Projection for a 25-Truck Operation
Year 0: Acquisition Cost — Where the Gap Begins
The most significant financial hurdle in EV fleet adoption remains the upfront purchase price premium. A Class 6–7 diesel delivery truck in 2026 carries an average purchase price of $80,000 to $95,000. A comparable battery-electric truck from manufacturers including Freightliner eCascadia, Lion Electric, or BYD's commercial lineup typically ranges from $150,000 to $200,000 before incentives — an upfront premium of $55,000 to $110,000 per vehicle. Across a 25-truck fleet, that premium represents a total additional capital outlay of $1.375 million to $2.75 million at the point of acquisition.
This premium is where incentive stacking becomes the most consequential financial decision in an EV fleet conversion. Under the IRA's Section 45W Qualified Commercial Clean Vehicle Credit — which was available for vehicles acquired on or before September 30, 2025 — heavy-duty commercial EVs qualified for credits up to $40,000 per vehicle. Fleets that executed purchase agreements before that deadline and placed vehicles in service thereafter could claim those credits. State programs add further offset: California's HVIP provides point-of-sale vouchers reaching $120,000 for Class 8 trucks; New York's Clean Truck Program offered vouchers up to $185,000. For 2026 acquisitions, no broad federal credit is currently available, making Section 179 depreciation deductions and bonus depreciation the primary federal tax tools. Fleet operators considering electrification should consult a tax advisor on current-year deduction strategies. Sign up with FleetRabbit to access our EV fleet financial modeling tools and calculate your specific incentive-adjusted acquisition cost.
Years 1–5: Fuel Cost — Where EV Wins Every Year
Fuel cost is the single largest annual operating expense difference between diesel and electric fleets, and it begins compounding in the EV's favor from the first mile driven. Using current verified data: diesel fuel costs approximately $0.47 per mile for a Class 6–7 truck at 8 mpg and $3.75 per gallon. Commercial electricity at $0.14 per kWh and 2.1 kWh per mile produces an electricity cost of $0.29 per mile — a savings of $0.18 per mile over diesel. At 60,000 miles per truck per year, that is $10,800 in annual fuel savings per vehicle. Across 25 trucks, the fleet-level annual fuel savings total $270,000 per year.
Over five years, cumulative fuel savings for the 25-truck fleet reach $1.35 million — assuming flat fuel prices. Diesel price volatility adds additional EV advantage: each $0.25 per gallon increase in diesel widens the per-mile savings gap by approximately $0.031, adding $4,650 per truck or $116,250 fleet-wide per year in incremental savings. Fleets operating in high-electricity-cost states should model local commercial electricity rates, which vary significantly from the national average. Book a FleetRabbit demo to run a fuel cost projection model using your specific diesel consumption data and regional electricity rates.
FleetRabbit's EV TCO modeling tools let you input your specific fleet size, mileage, duty cycle, and regional energy costs — and return a detailed 5-year projection with payback timeline and annual savings breakdown.
Years 1–5: Maintenance Cost — The Compounding Advantage
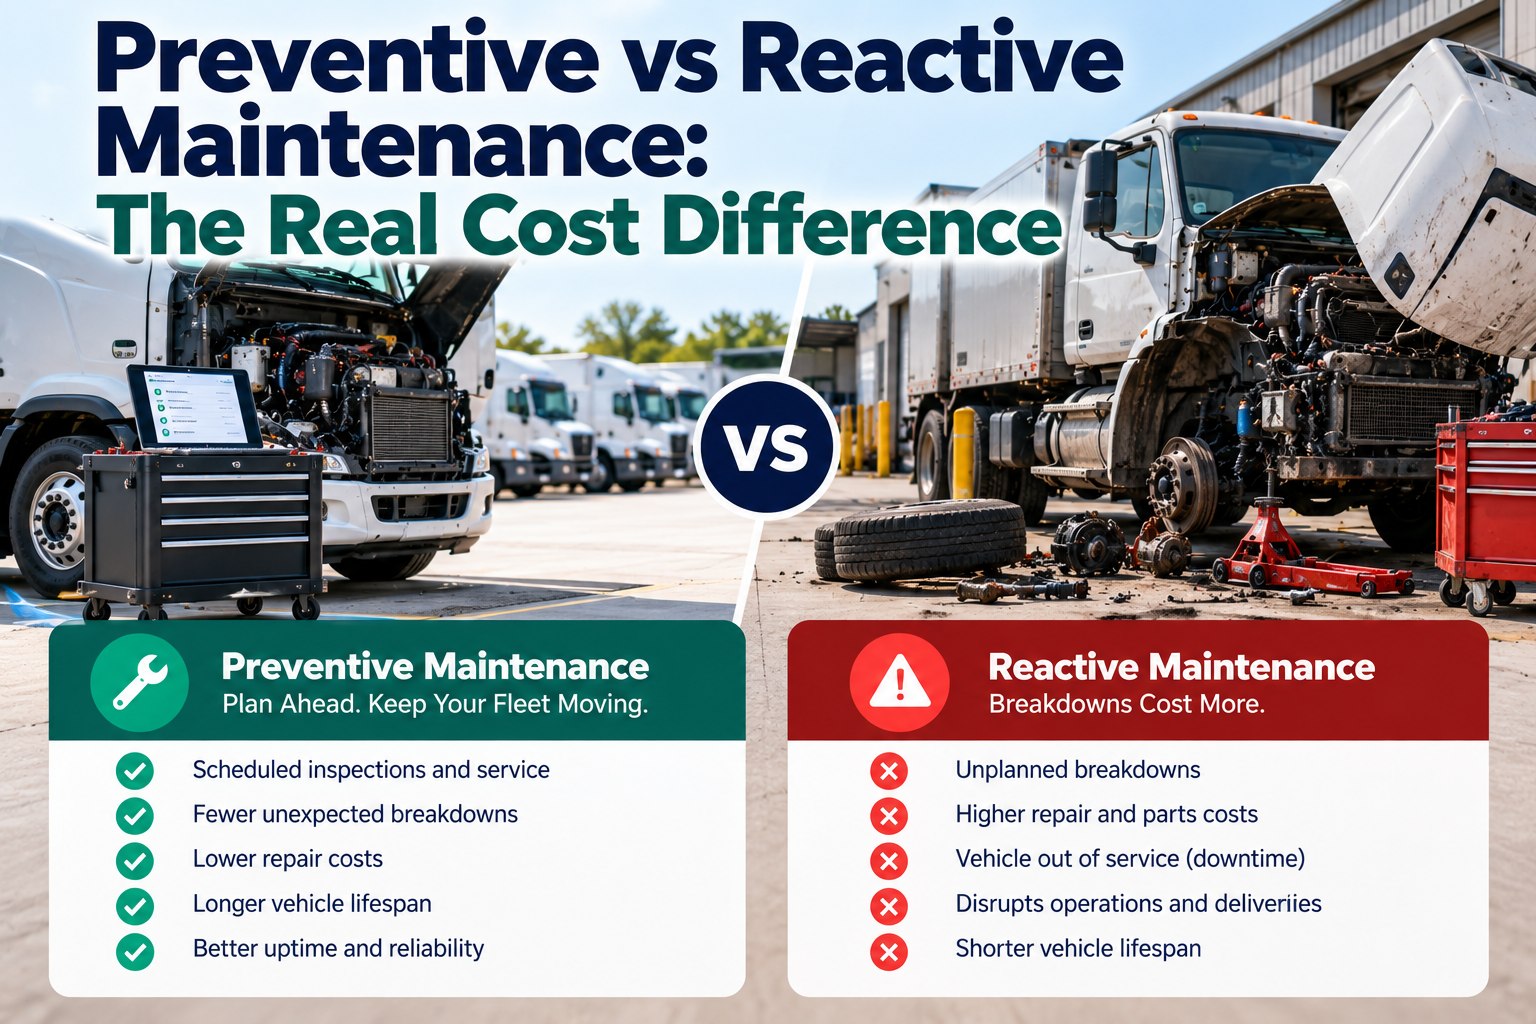
EV maintenance savings are one of the most consistently documented financial advantages of fleet electrification — and they compound every year. Electric motors have dramatically fewer moving parts than diesel powertrains: no oil changes, no transmission rebuilds, no exhaust systems, no diesel exhaust fluid (DEF) systems, no turbocharger service, and no emissions system maintenance (DPF, EGR, SCR). Studies across commercial fleet deployments show EV maintenance costs are approximately 40 to 50% lower than for equivalent ICE vehicles, and EVs require $6,000 to $12,000 less in maintenance over their lifespan per vehicle.
For a medium-duty diesel fleet, annual maintenance costs per vehicle typically range from $8,000 to $14,000 depending on age, duty cycle intensity, and route profile. An equivalent EV fleet typically runs $4,000 to $7,500 per vehicle annually — a per-truck maintenance saving of approximately $4,000 to $6,500 per year. Regenerative braking reduces brake wear by 50 to 70%, extending brake service intervals significantly and eliminating one of the highest-frequency maintenance costs on high-cycle delivery routes. Across 25 trucks at an average maintenance saving of $5,000 per truck annually, the fleet-wide maintenance savings total $125,000 per year — reaching $625,000 over the five-year projection period. Sign up with FleetRabbit and track maintenance cost-per-mile across your diesel fleet today to establish your baseline before modelling EV savings.
The 5-Year TCO Summary: When Does EV Break Even
Combining all cost categories — vehicle acquisition, charging infrastructure, fuel, and maintenance — across the five-year projection period produces the complete TCO picture for this 25-truck fleet model. The EV fleet carries a higher Year 0 capital outlay, but the compounding operational savings begin closing the gap immediately. For medium-duty urban and regional delivery fleets operating in incentive-accessible markets, break-even against diesel typically occurs between Year 3 and Year 4 of the projection period.
This model produces a 5-year EV TCO advantage of approximately $390,000 for a 25-truck medium-duty fleet operating at 60,000 miles per year per vehicle in an incentive-accessible market. The break-even point falls between Year 3 and Year 4. Fleets operating at higher annual mileage, in higher-diesel-cost markets, or with access to stronger state incentives will see faster payback timelines. Fleets in high-electricity-cost states, running lower annual mileage, or operating without access to incentive programs will see longer payback timelines ranging from 4 to 6 years. The operational savings from fuel and maintenance do not stop at Year 5 — they continue to compound across the vehicle's full service life, typically 10 to 15 years for commercial trucks, creating a long-term EV financial advantage that grows significantly beyond this projection window. Book a FleetRabbit demo to build a TCO model calibrated to your fleet's specific duty cycle, mileage, and regional energy costs.
FleetRabbit models your 5-year EV TCO against your current diesel operating costs — factoring in your mileage, electricity rates, incentive eligibility, and charging infrastructure requirements.