2026 marks the year when mixed EV-diesel fleets stop being experimental and become the financial backbone of modern commercial. Fleet managers who blend battery-electric trucks with efficient diesel assets are seeing 14–19% lower cost-per-mile compared to diesel-only operations, while hedging fuel volatility and carbon compliance. But the economics only work when you match powertrain to mission — urban delivery with EVs, long-haul with next-gen diesel, and unified data across both. This deep-dive covers real TCO data, charging strategies, and the transition roadmap that makes mixed fleets profitable today.
Running a Mixed EV & Diesel Fleet: Real Economics, Transition Data & Total Cost of Ownership
Diesel-First Fleet
Mixed EV-Diesel (50/50 by utilization)
Mixed fleet delivers up to $18,900 annual savings per truck equivalent. Sign up on FleetRabbit to calculate your precise mixed-fleet TCO.
EV + Diesel Synergy Lowers Cost Per Mile
Mixed-fleet reduces exposure to energy spikes and spreads capital costs efficiently. Book a demo with FleetRabbit for a customized TCO model based on your routes and utility rates.
Fuel Price Resilience
EV portion acts as a natural hedge: when diesel spikes, blended fuel cost per mile rises only half as much. Mixed fleets reported 28% less volatility in 2025–2026 energy budgets.
Sign upMaintenance Optimization
EVs need 50% fewer scheduled repairs, allowing you to redeploy diesel techs for major overhauls while EV miles lower overall downtime by 11% across mixed fleets.
Regulatory Flexibility
Meet CARB/EPA emissions glide paths without scrapping diesel assets early. Mixed fleets earn incentives while extending life of legacy trucks on low-mileage roles.
Book demoAccording to the 2026 Fleet Technology Monitor, 58% of commercial fleets with over 100 vehicles are currently piloting mixed EV-diesel configurations. Early adopters achieved 12–18% lower net operating costs within 18 months. The optimal transition sequence: identify return-to-base routes under 220 miles for EV deployment, install shared chargers at depots, and keep modern diesels for unpredictable or high-mileage lanes. Unified fleet management software becomes critical — tracking state of health for high-voltage batteries alongside diesel emission systems.
Mixed fleets also benefit from dynamic load allocation: on days when electricity prices drop (off-peak or renewables surplus), shift more local loads to EVs. Conversely, when diesel prices fall, prioritize diesel for margin routes. This flexibility delivers an extra $4,000–$6,000 annual savings per vehicle. Sign up on FleetRabbit to implement load-shift optimization and real-time cost tracking across powertrains.
Best for EV in Mixed Fleet
- Daily routes ≤ 220 miles, return to depot
- Stop-and-go, predictable urban delivery
- Low-cost overnight charging (sub $0.12/kWh)
- High regulatory incentive regions (CA, NY, WA)
- Light to medium freight density
Best for Diesel in Mixed Fleet
- Long-haul OTR > 400 miles/day
- Extreme cold climates / remote areas
- Heavy-haul, construction, high GVWR
- Rapid back-to-back dispatch cycles
- Legacy fleet with existing diesel service centers
Correct powertrain assignment improves ROI by up to 22%. Book a demo with FleetRabbit to automate vehicle-to-route matching using mixed-fleet intelligence.
Run your mixed EV-diesel fleet with total confidence
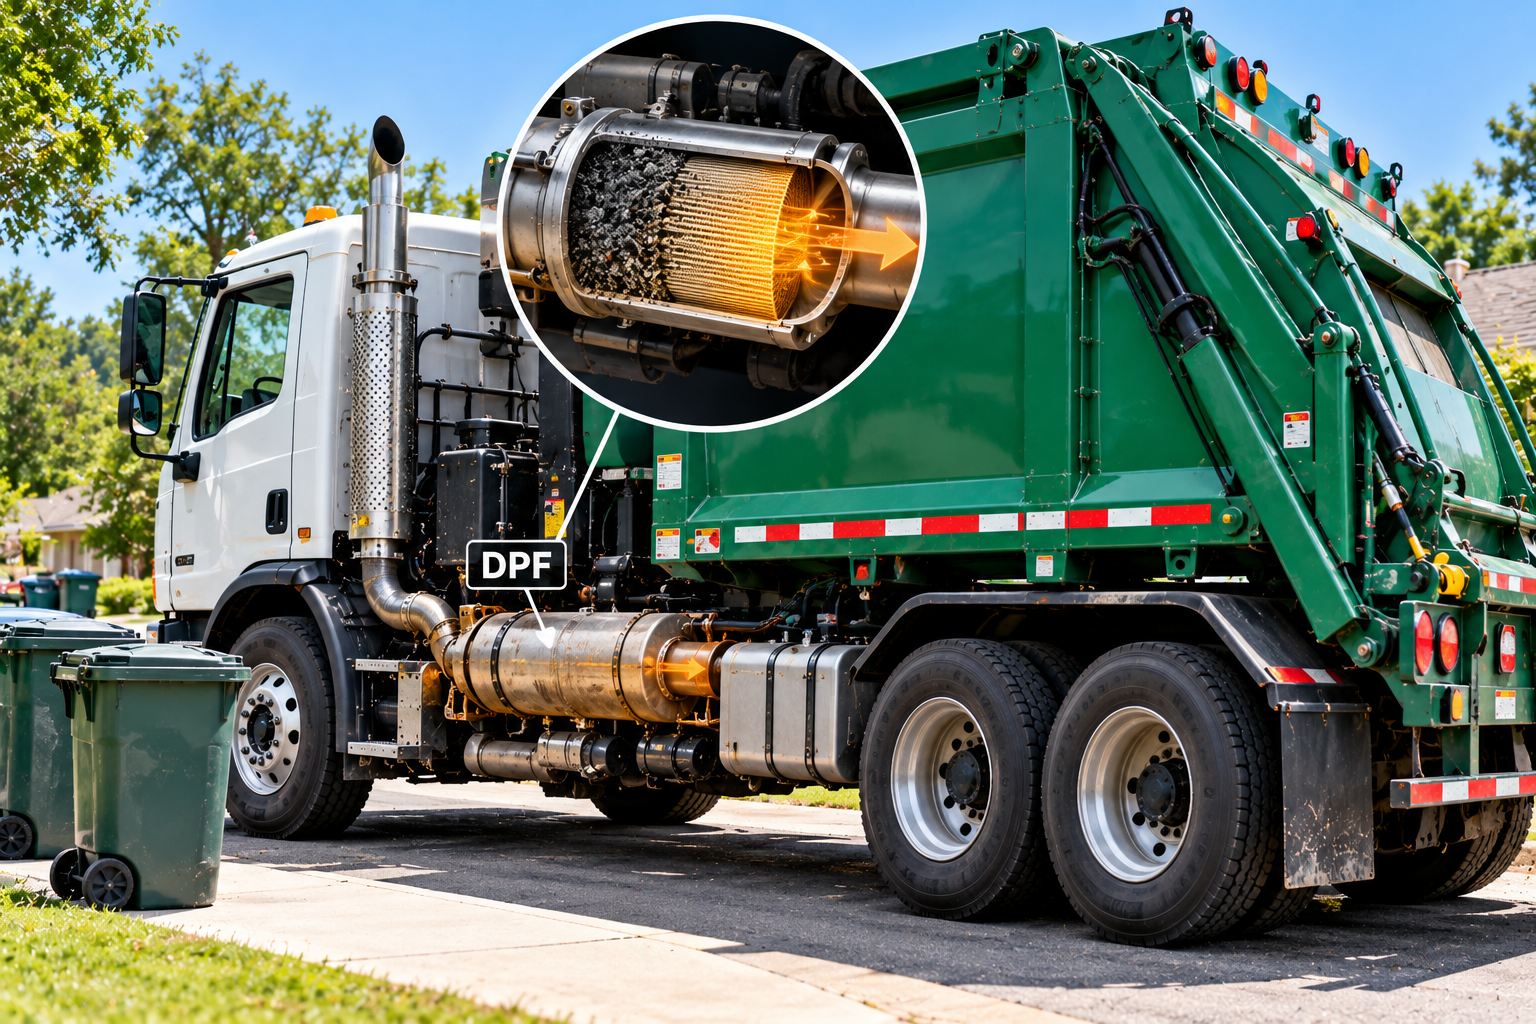
FleetRabbit gives you unified dashboards for electric and diesel assets — track cost per mile by powertrain, schedule EV battery service, monitor DPF health, and forecast energy spend. Stop managing spreadsheets. Start optimizing your fleet mix today.
How Smart Energy Management Boosts Mixed Fleet Margins
Deploying depot charging for EVs doesn't have to be a million-dollar project. Many mixed fleets succeed with a phased approach: 60–80kW AC chargers for overnight replenishment and 150kW DC for midday top-ups. By leveraging utility demand response and time-of-use rates, mixed fleets slash EV charging costs by 38% compared to on-peak. Additionally, diesel assets can be scheduled on high-energy-price days to preserve battery range for cheaper windows. Sign up on FleetRabbit to get automated charging schedule recommendations tied to real-time utility rates.
Real-world example: A Midwest carrier with 22 EVs and 35 diesels reduced total fuel+electric spend by 26% in Q1 2026 by shifting 80% of EV charging to midnight-6am and using diesel for surge pricing days. Total fleet cost per mile dropped from $0.71 to $0.59 within six months. The key enabler? Centralized software that logs each vehicle's energy mix and suggests daily assignment. Book a demo to see how FleetRabbit orchestrates mixed-fleet energy optimization.
Get real-time visibility across EV & diesel fleets
Whether you manage 10 trucks or 500, FleetRabbit combines maintenance logs, energy cost tracking, driver assignments, and warranty events for both electric and diesel vehicles. See why mixed fleet leaders choose us to drive down cost per mile and improve uptime.