A supplier scorecard only changes behaviour if the supplier accepts the number. That sounds obvious and it is where most programmes fail — the metric was defined internally, calculated from a source the supplier cannot see, and delivered as a grade rather than agreed as a measurement. What follows is a quarterly meeting spent arguing about the data instead of the performance. The industry has already solved most of this: Odette and AIAG jointly publish a recommendation for automotive supply chain indicators specifically so that different customers measure logistics performance the same way, making a supplier's results comparable across its customer base and letting customers build appraisal systems on standard definitions rather than bespoke ones. Adopt the standard, source the numbers from transaction data both parties can trace, and the conversation moves from whether the figure is right to what to do about it. Book an architecture review to see the data layer underneath a scorecard that holds up.
Supply Chain Governance · Supplier Performance
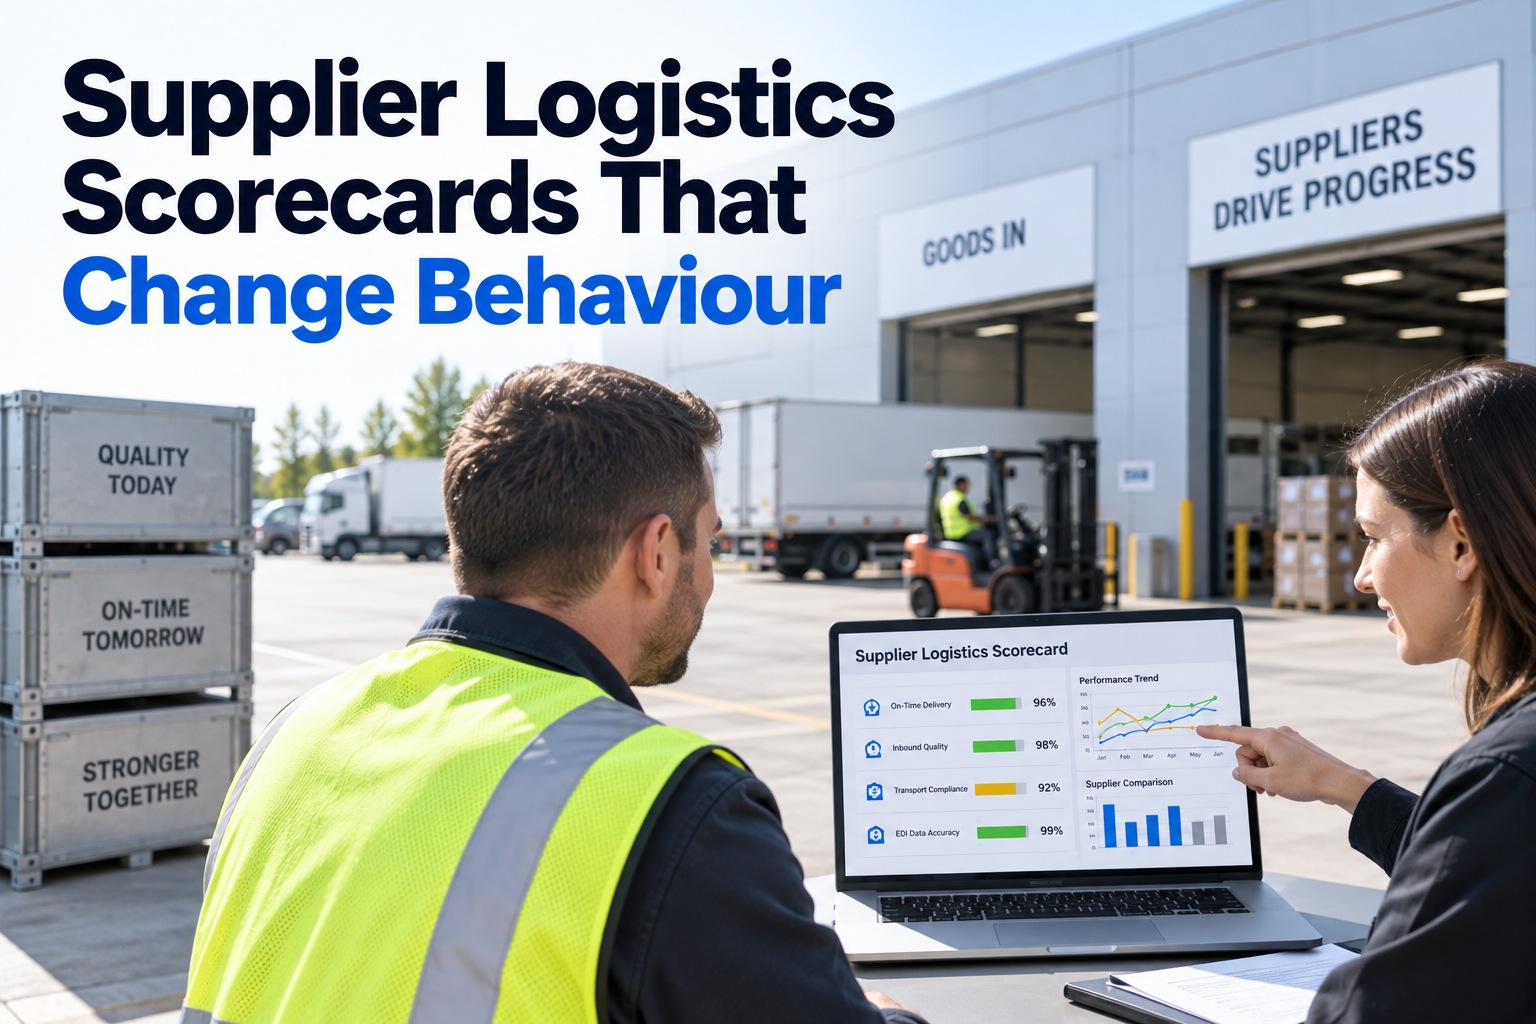
Supplier Logistics Scorecards That Change Behaviour
Metrics drawn from standard definitions rather than invented locally, calculated from transaction data both sides can trace back to a source, published on a cadence suppliers know in advance, and connected to sourcing decisions so the result carries a consequence.
Odette / AIAG KPIs for Automotive SCM
MMOG/LE
Odette EDI performance messages
Catena-X
A Governance Instrument, Not a Report Card
The distinction determines what the scorecard is allowed to do, and most of the value sits in the third card.
It is not a payment verification tool
Scorecards get confused with invoice checking, and the two have different purposes. A scorecard converts raw performance data into a structured, comparable benchmark across the whole supply base — the point is the comparison, not the transaction.
It produces a rating, and the rating carries weight
The output feeds sourcing decisions, contract renewals and quarterly business reviews. A score with no bearing on any of those is a newsletter, and suppliers work out very quickly which kind they are receiving.
Which is why it changes behaviour at all
Behaviour follows consequence. Where the scorecard genuinely influences allocation and renewal, the supplier's own management pays attention to it — and organisations running structured supplier scorecards report stronger relationships alongside a reduction in supply chain risk in the region of 15 to 25 per cent.
Choosing the Metrics, With Published Thresholds
Five to eight cross-functional metrics plus two or three category-specific ones is the commonly recommended shape. Every one should tie to an owner and to a decision it informs.
Two disciplines make that list work. Avoid vanity metrics — anything that cannot be tied to a named owner and a specific decision is measurement for its own sake. And the two hard metrics, delivery service and defect rate, have to be derived from transaction data in the enterprise or warehouse system to be credible, because a figure assembled by hand is a figure the supplier can reasonably question.
Capability and Performance Are Different Questions
A distinction the industry standards draw explicitly, and confusing the two produces a scorecard that punishes the wrong thing.
Capability
What the supplier is set up to achieve
The Odette and AIAG assessment tool is the recognised industry standard for measuring the supply chain management capability of your own logistics organisation and of your partners. It identifies where shortcomings and weaknesses sit, and gives a means of planning and checking improvement against them.
Performance
What actually happened last month
Indicators measure delivered results. As the standards themselves put it, capability is one thing and actual performance is another — which is why major operators run both rather than treating an assessment score as a proxy for delivery reliability.
Together
The pair tells you which response fits
Poor performance with strong capability is usually an execution or demand-signal problem you may have contributed to. Poor performance with weak capability is a development or sourcing question. The same delivery number means two entirely different things depending on which of those it sits beside.
Can your suppliers trace every number on their scorecard back to a source?
If not, the quarterly meeting will be about the data rather than the performance. Bring a current scorecard and a month of underlying delivery records to a 30-minute architecture review and we'll trace each metric back to its source transaction in Fleet Rabbit — showing where the calculation is defensible and where it rests on a manual step nobody documented.
Data Both Sides Accept
Four requirements. The first is a definition problem, the rest are plumbing — and all four have industry answers rather than needing invention.
01
Use standard definitions, not house ones
The joint Odette and AIAG recommendation exists precisely to harmonise how different customers measure logistics performance, so a supplier's results become comparable across its customers and appraisal systems can be built on standard indicators. A bespoke definition guarantees a bespoke argument.
02
Put the definitions in the agreement
Organisations are encouraged to define their indicators and expectations within their supply chain management agreements. A metric agreed contractually is a metric nobody relitigates in a review — the negotiation happened once, at the right moment.
03
Map every source and write a data dictionary
Identify which system each figure comes from, define the calculation logic, set the refresh frequency, and record lineage notes. This is the artefact that ends disputes — when a supplier questions a number, you show the path from transaction to score rather than re-running a spreadsheet.
04
Move performance and incident data by message, not by attachment
Odette has developed message formats specifically for transferring performance and incident data electronically, on the basis that standardised exchange eliminates human error and conveys the information faster. Agree the problem-resolution format alongside it — whether that is a structured problem report, an eight-discipline format or an A3 — so incidents arrive in a shape both sides already understand.
On the wider data question, the direction of travel is worth noting. Frameworks emerging for the automotive value chain are built to let participants exchange selected information through common standards while retaining control of their own data rather than surrendering it to a central platform. That model matters for scorecards specifically, because supplier willingness to share operational data depends entirely on how much control they keep over it.
Share the Rules Before You Grade
The single practice that separates a scorecard suppliers engage with from one they resent.
Criteria, weighting and cadence, in advance
Share all three with suppliers before grading begins. A scorecard should function as a roadmap toward a target rather than as a trap sprung at a review — and a supplier who knows how they will be measured can actually manage toward it.
Keep the layout identical across suppliers
Consistent presentation makes results comparable and removes the suspicion that different suppliers are being assessed differently. It also lets a supplier reading their own scorecard understand it without explanation, which is the point.
Show trend alongside the current figure
Publish monthly and trailing twelve-month trends with flags against target and space for commentary. A single late delivery may be an anomaly; three months of declining delivery performance is a trend requiring action — and only the trend view distinguishes them.
A Cadence That Produces Decisions
Two rhythms, each with a different scope and a different audience. Published templates converge on this structure.
The accountability split that makes this run is worth stating explicitly: category management owns the scorecard and the cadence, quality owns findings and corrective actions, logistics owns delivery performance, finance owns cost variance. Four owners rather than one committee, which is what stops a review becoming a discussion nobody is responsible for acting on.
Connecting the Score to a Consequence
Four linkages. Without at least one of them, the scorecard is a measurement exercise rather than a governance instrument.
AllocationVolume shifted toward suppliers performing above threshold, at the point where a category has more than one qualified source. This is the most direct consequence available and the one suppliers respond to fastest.
Contract renewalPerformance history as an input to renewal rather than a separate conversation, so the trailing twelve months carry weight at the moment terms are set.
Qualification and onboardingScorecard thresholds connected to the standards applied when a supplier is first qualified, so the bar for staying in the base matches the bar for entering it.
Development investmentThe constructive linkage, and the one that distinguishes a partnership from a ranking. Where capability assessment shows a specific weakness, the response is a development plan against it rather than a lower grade — which is what the assessment tools were designed to support.
Standing It Up in Six Weeks
A sequence drawn from published implementation templates. It is deliberately narrow at the start.
Days 0–15
Two categories, one metric set
Pick two categories rather than the whole base, select the indicator set, finalise targets and templates, and document category-specific exceptions. Starting narrow is what makes the first published scorecard defensible.
Days 16–45
Connect sources and backfill history
Map the systems each figure comes from, backfill six to twelve months so trends exist on day one, and publish draft scorecards. A scorecard opening with a single month of data cannot distinguish an anomaly from a pattern.
Before publishing
Walk suppliers through the draft
Criteria, weighting, cadence and the data lineage behind each figure, shared before the first graded period rather than at the first review. The objections raised at this stage are cheap; the same objections raised after a rating has been issued are expensive and slow.
See a scorecard traced back to its source data
On an architecture review we'll take one supplier's current scorecard and one month of underlying records into Fleet Rabbit — mapping each metric to the transaction it derives from, identifying which figures currently pass through a manual step, and showing the lineage view you would hand a supplier who questions a number. You keep the mapping either way.
Frequently Asked Questions
Which metrics should a logistics scorecard carry?
Five to eight cross-functional metrics plus two or three category-specific ones is the commonly recommended shape. Delivery service and defect rate are the two hard metrics that determine operational reliability, alongside lead-time adherence, expedite cost, corrective action ageing and audit score. Every metric should tie to a named owner and a specific decision it informs — anything that cannot is a vanity metric and should come off the sheet.
What thresholds are commonly cited?
World-class operations are described as maintaining delivery performance of 95 per cent or above, with tighter programmes setting a guardrail at 98. A defect rate below 500 parts per million is the standard threshold in automotive and precision manufacturing, with some programmes setting 250. Published example guardrails also include expedite cost at or below 0.5 per cent of spend and an audit score of 90 or above. Treat these as reference points and set your own by category.
Why use industry standard definitions rather than our own?
Because harmonisation benefits both parties. The joint Odette and AIAG recommendation exists so different customers measure logistics performance the same way — making a supplier's results comparable across its customer base, and letting customers build appraisal systems on standard indicators rather than bespoke ones. A supplier scored differently by every customer cannot manage to any of them coherently, and a house definition guarantees the review starts with a definitional argument.
How do we stop reviews becoming arguments about the data?
Derive the hard metrics from enterprise or warehouse transaction data rather than assembling them manually, and build a data dictionary recording each source, the calculation logic, the refresh frequency and the lineage. When a figure is questioned you show the path from transaction to score instead of re-running a spreadsheet. Transferring performance and incident data through standardised electronic messages rather than attachments removes another layer of manual error.
What is the difference between capability and performance measurement?
Capability assessment measures what a supplier's supply chain organisation is set up to achieve and identifies where weaknesses sit; performance indicators measure what actually happened. The standards are explicit that capability is one thing and actual performance another, which is why both are run rather than treating an assessment score as a proxy for delivery reliability. The pair also tells you which response fits — poor performance with strong capability is usually an execution or demand-signal issue rather than a sourcing one.
What review cadence works?
A monthly operations review of around an hour covering delivery, quality, incidents and open corrective action status, plus a quarterly business review covering indicator trends, cost against should-cost, initiatives, quality and audit, risk and innovation. Add continuous automated flagging of threshold breaches so exceptions surface when they occur rather than at the next meeting. Split ownership four ways — category management, quality, logistics and finance — rather than running it as one committee.
How do we make a scorecard actually change behaviour?
Attach a consequence and share the rules first. The score has to influence allocation, renewal or qualification, since a rating that affects nothing gets treated accordingly. And criteria, weighting and cadence should be shared with suppliers before grading starts — a scorecard is a roadmap toward a target, not a trap sprung at a review. Organisations running structured supplier scorecards report stronger relationships alongside a supply chain risk reduction in the region of 15 to 25 per cent.
Start free with three assets and build the data layer first.
Agree the Measurement, Then Discuss the Performance
Use the standard definitions rather than inventing your own, write them into the agreement, derive the hard numbers from transaction data with lineage a supplier can follow, publish criteria and cadence before the first graded period, and connect the result to allocation — because a scorecard nobody disputes and nothing depends on are two different failures with the same symptom.
Thresholds, cadences and framework references are drawn from published industry standards and practitioner guidance, and vary by category, region and agreement — confirm the definitions and targets applying to your own supply chain management agreements.
September 8, 2026
By Emily Davis
All Articles