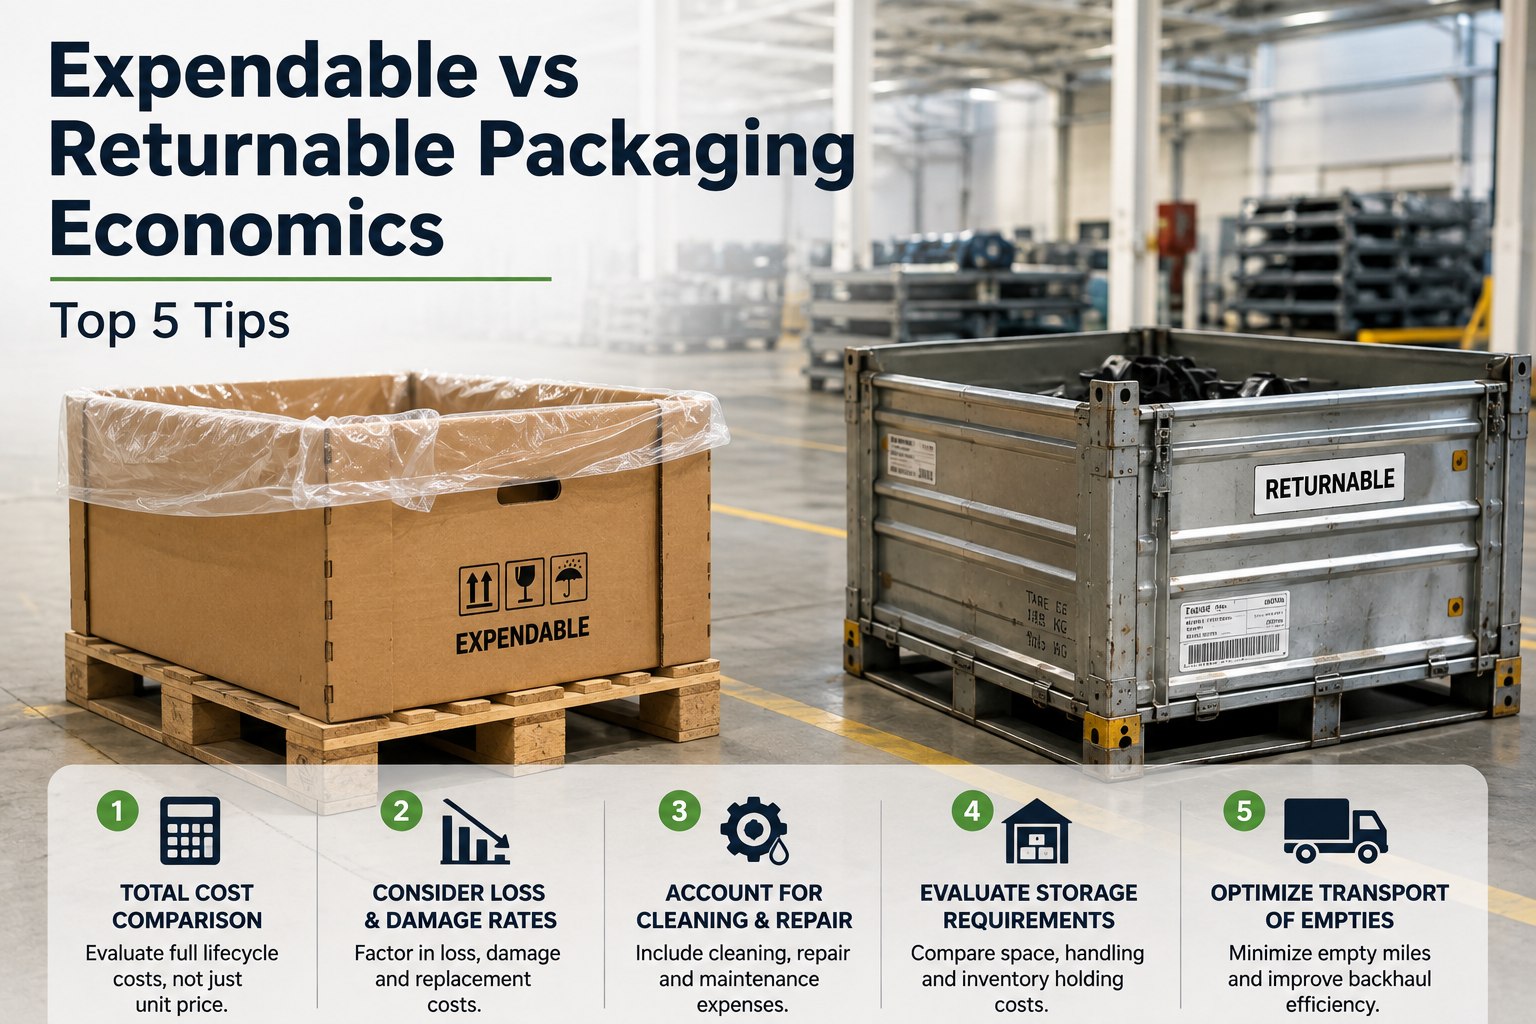
Expendable versus returnable is not a philosophy question and it is not a sustainability question, though it gets argued as both. It is a unit-cost-per-trip question with a known crossover, and the reason it produces so much disagreement inside plants is that nobody owns the whole number. Purchasing sees a purchase price and concludes corrugated is cheaper. Logistics carries the empty return legs and concludes returnables are expensive. Operations absorbs the cleaning, the storage and the damage, and is rarely asked. Meanwhile the actual answer is well established in shape: total cost of ownership analyses consistently favour reusable systems after roughly ten to fifteen rotation cycles depending on how hard the application works the container — and despite that, reusable transit packaging still accounts for only around 35% of global supply chain packaging, which tells you how often the calculation is either not done or done on the wrong scope. Ask for the deployment brief to run it properly on your own part families.
TOP 5 · PACKAGING ECONOMICS
Expendable vs Returnable Packaging Economics
A total cost comparison that counts loss rate, cleaning, storage and the transport of empties — plus the five moves that shift the answer and the variables that decide it part by part.
Rotation cycles completed
Expendable still ahead
Crossover zone, cycles 10–15
Reusable ahead, and widening
Where a part sits on this strip is decided by how often the container actually turns — which makes cycle time, not unit price, the variable that settles the argument.
The Two Calculations, Side by Side
Both are per-use figures, which is the only basis on which they are comparable. Almost every disagreement inside a plant comes from comparing a purchase price on one side against a per-use cost on the other.
Reusable, per use
Purchase price ÷ expected cycles
+ reverse logistics cost per use
+ maintenance and cleaning per use
+ loss replacement per use
The first term shrinks with every cycle. The other three do not — which is why cycle count decides the outcome and loop discipline decides the cycle count.
Expendable, per use
Material cost per shipment
+ disposal fees
+ additional packing labour
+ damage attributable to weaker protection
Flat per trip and therefore predictable — but operations that track the full picture generally find expendable costs more per trip than the purchase price suggests.
The one-line version
Cost of the returnable fleet divided by cycles in service, against expendable cost per trip multiplied by the same number of trips. Everything else on this page is either an input to that comparison or a reason the inputs are wrong.
Five Ways to Cut the Cost
Ordered by effect. Note that the first two do not change which packaging you use — they change the number the comparison produces, which frequently changes the answer without any capital decision at all.
01
Raise cycles before you buy anything
The first term in the reusable calculation is purchase price divided by expected cycles, so anything that shortens the loop improves the economics directly and permanently. A fleet completing eight cycles a year takes years to justify; the same fleet at thirty pays back in months. Empty dwell at the plant and slow collection are usually where the cycles are lost, and both are fixable without spending.
ChangesThe denominator on every reusable part you own, immediately
02
Cost the empty return leg honestly, then fill it
Reverse logistics sits in the reusable calculation whether or not anyone measures it, and it is the term most often left out — which flatters returnables in the business case and then disappoints in operation. Cost it per lane, then attack it: empties riding a leg that already runs are close to free, which is precisely why the comparison should be done after backhaul planning rather than before.
ChangesA cost line that often decides borderline parts either way
03
Attack loss rate rather than pool size
Loss replacement is a per-use cost that scales with how badly the loop is controlled, and the instinctive response — buying more containers — makes the per-use figure worse rather than better, because the same losses now sit against a larger fleet with lower rotation. Contracted return deadlines and identity discipline reduce the numerator; adding units only inflates the denominator's cost.
ChangesLoss replacement per use, and prevents the expensive reflex
04
Count the damage difference as a cost line
Inconsistent protection from expendable packing produces damage that is real, recurring and almost never attributed to the packaging decision. Automotive parts are particularly exposed — vibration damage to delicate components and contamination from packaging dust are both known failure modes that better-engineered containers reduce. If your current damage rate is material, it belongs on the expendable side of the ledger.
ChangesThe expendable per-trip figure, often substantially
05
Split the decision by lane, not by part
The answer is frequently both. Returnable racks on the main closed loop where volume and route are stable, expendable on one-off shipments, export lanes where packaging will not come back, and low-volume tails. Treating it as a single choice per part forces one lane's economics onto another's, and it is usually the export lane that ruins an otherwise sound returnable case.
ChangesWhich lanes get counted in the cycle calculation at all
Two of the five levers cost nothing and change the answer.
The deployment brief covers per-use cost modelling for both options, cycle measurement across the full loop, reverse logistics costing per lane, and the lane-splitting logic that stops one route's economics distorting another's.
Cost Lines Usually Missed
Each of these belongs to one side or the other and is routinely counted on neither, because it sits in a budget that is not the packaging budget.
← Swipe to see all columns →
Read the "usually sits in" column on its own. Every one of these costs lives outside the packaging budget, which is why a comparison run by any single function reaches a confident and wrong answer. The comparison has to be assembled across functions or it should not be trusted — and that, rather than the arithmetic, is the hard part.
Which Side a Part Falls On
Four conditions favour each. Where three or more line up on one side, the answer is usually clear before any modelling; where they split, the model earns its keep.
Returnable wins when
High shipment volume — more trips amortise the fleet faster
A fixed loop between known points with an established return route
Valuable or damage-prone parts where protection matters
A multi-year programme rather than a short run
A practical trigger: more than roughly 250 shipments a year, a damage rate from current packaging, an established return route, and a programme running beyond eighteen months.
Expendable wins when
One-off or irregular shipments with no repeat pattern
Export lanes where the packaging will not come back
Very low volumes, where the fleet never accumulates cycles
Bulky or awkwardly shaped items that returnables suit poorly
Plus the genuine operational advantages: flexibility as volumes and destinations change, no tracking system, minimal storage, and straightforward inventory management.
The mixed answer is the normal answer
Many programmes run both deliberately — returnable racks on the main loop, expendable for one-off and export lanes. That is not indecision, it is the correct result of applying the same calculation to lanes with different characteristics. What causes trouble is applying one lane's answer across all of them.
What the Conversions Actually Delivered
Published automotive examples, useful mainly for the shape of the saving rather than the absolute figures — which depend entirely on volume, loop length and part value.
Collapsible containers replacing corrugatedA vehicle logistics operation moved carpet from one-time-use corrugated boxes on pallets to large collapsible reusable plastic containers that stack and travel pallet-free, eliminating 3,000 tons of combined wood and cardboard waste and saving $3.5 million in expendable packaging.
Returnable totes on a floor-mat lineExpendable packaging replaced with returnable totes for an annual saving of $28,000 — container costs of $3,500 amortised over four years against a net annual saving of $24,500.
Protective plastic returned for reuseProtective plastic packaging returned to suppliers for reuse rather than discarded, producing an annual saving of $99,000 on a single flow.
The processing cost was a washIn one documented case the cost to process returned packaging was found to be equivalent to the previous cost of processing and disposing of the expendable packaging — the saving came entirely from not buying it again.
That last case is the useful one. The reverse logistics cost that everyone fears is frequently offset by the disposal and handling cost it replaces, which means the comparison is far less lopsided than the intuition suggests — but only where the return route already exists.
Running the Comparison Properly
Six steps. The scoping step is where most exercises fail, before any number is calculated.
1Scope across functions firstPurchasing, logistics, operations and quality each hold part of the cost. Agree who contributes which line before anyone builds a model.
2Measure real cycles, not design cyclesExpected cycles is the single most influential input and the one most often taken from a brochure rather than from your own loop.
3Cost the reverse leg per laneNot as a network average. A lane with an existing backhaul and a lane without have completely different reusable economics.
4Include damage on both sidesExpendable's weaker protection is a cost, and returnable's damage-in-service is one too. Counting neither is common; counting only one is worse.
5Test sensitivity to cycles and lossThose two inputs dominate. If the answer flips within a plausible range of either, the decision is really about loop discipline rather than packaging.
6Re-run it on a scheduleVolume, sourcing distance, disposal cost and regulation all move. A decision made once and never revisited is a decision made on obsolete inputs.
Run it on your own part families
We build the per-use comparison from your measured cycle times, real loss rates, lane-level reverse logistics cost and current damage figures — and identify which lanes should split rather than convert wholesale.
What to Measure Afterwards
Five figures, because a conversion is a decision that has to keep being right. Our analytics and reporting module carries them.
Realised cycles per unit per yearAgainst the figure the business case assumed. This is the input the whole decision rested on, and it is the one most likely to have been optimistic.
All-in cost per useAmortisation, reverse logistics, maintenance and loss replacement combined. The only number comparable to an expendable per-trip cost.
Loss rate per container typeRising loss silently pushes a converted part back toward the expendable side without anyone re-running the comparison.
Damage rate before and afterThe benefit most often claimed in the business case and least often verified afterwards.
Reverse leg fill rateEmpties riding legs that already run cost close to nothing. Falling fill quietly reintroduces the cost the case assumed away.
Frequently Asked Questions
How many trips before returnables pay back?
Total cost of ownership analyses consistently favour reusable systems after roughly ten to fifteen rotation cycles, depending on how intensively the application uses them. That makes rotation frequency rather than unit price the decisive variable: a container completing thirty cycles a year clears the threshold inside months, while one completing eight takes years and may never justify itself. On high-volume programmes with a fixed loop, payback often lands within the first year.
What is the correct formula?
Compare per-use costs. Reusable per use is purchase price divided by expected cycles, plus reverse logistics per use, plus maintenance per use, plus loss replacement per use. Expendable per use is material cost per shipment, plus disposal fees, plus additional packing labour — and you should add damage attributable to weaker protection. The simplified version is the cost of the returnable fleet divided by cycles in service, against expendable cost per trip multiplied by the same number of trips.
When is expendable genuinely the right answer?
One-off shipments, export lanes where the packaging will not return, very low volumes, and bulky or awkwardly shaped items that returnables suit poorly. It also carries real operational advantages that rarely appear in cost models: flexibility as volumes and destinations change, no tracking system, minimal storage requirement and straightforward inventory management. Those are worth something, particularly for a supply base or a lane that is still unstable.
Should we convert a whole part or a whole lane?
A lane, in most cases. Many programmes run both deliberately — returnable racks on the main loop, expendable for one-off and export lanes — and that mixture is the correct output of applying one calculation to routes with different characteristics rather than a failure to decide. Forcing a single answer across every lane a part ships on usually means one export lane with no return route drags down an otherwise strong returnable case.
Does the return transport cost kill the case?
Less often than expected, and it depends entirely on whether a return route already exists. In one documented conversion the cost to process returned packaging turned out to be equivalent to the previous cost of processing and disposing of the expendable packaging, so the saving came from not buying it again. Where empties can ride a leg that is already running, reverse logistics is close to free; where a dedicated return journey has to be created, it can genuinely decide the answer against returnables.
Which costs get missed most often?
On the reusable side, empty return transport, cleaning and repair, storage of empties, loss replacement and the tracking system — all of which sit outside the packaging budget. On the expendable side, disposal fees, packing labour priced invisibly into the part, and damage from inconsistent protection. Because each of these lives in a different function's budget, a comparison run by any one function reaches a confident answer that happens to favour whichever costs it does not carry.
How often should the decision be revisited?
On a schedule, because the inputs move. Volume changes with the model cycle, sourcing distance changes the reverse leg, disposal costs move with regulation, and loss rate drifts as loop discipline slips. Regulatory pressure is also rising — European packaging rules phasing in from 2025–2026 set recycled content and reuse targets that directly encourage returnable adoption. A decision made once on a five-year-old input set is not a decision anyone should still be defending. Our
integrations overview covers the cycle and loss data sources.
Compare Per Use, Not Per Purchase
Cycles measured from your own loop rather than a brochure, reverse logistics costed per lane, damage counted on both sides, and the decision split by lane where the lanes genuinely differ.
Uses existing cycle and damage data · Works with any pool model · Site-level configuration