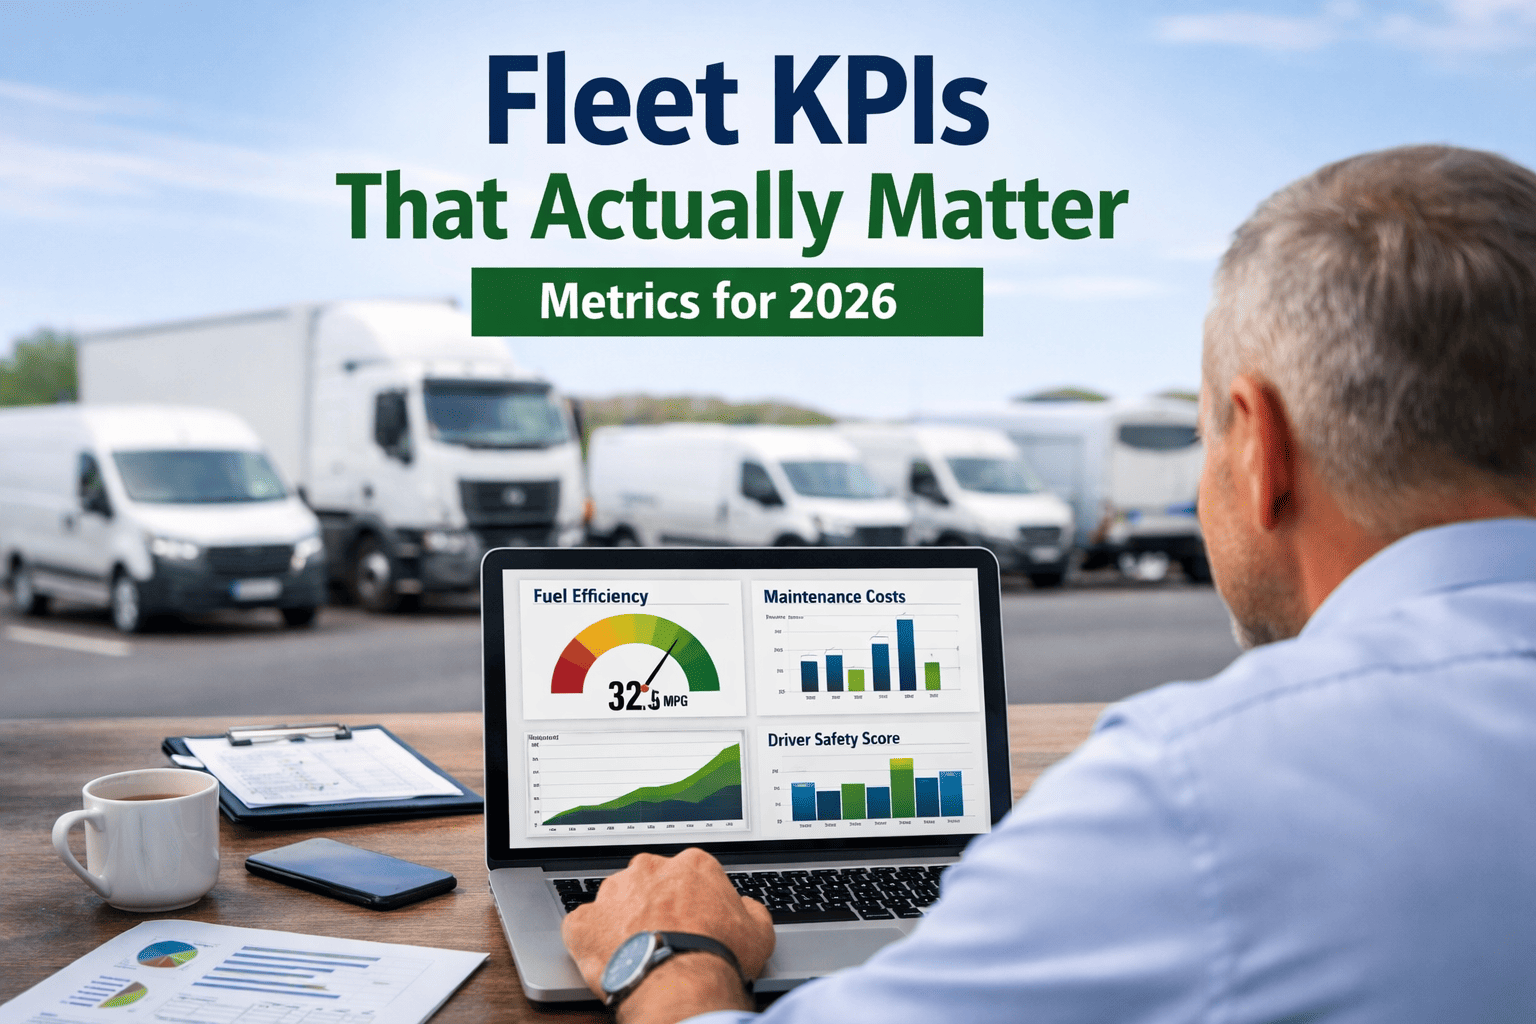
Fleet KPIs That Actually Matter | Metrics for 2026
By James Henderson on April 16, 2026
Most fleet managers are drowning in data but starving for insight. Dashboards with 30+ metrics. Weekly reports nobody reads. Spreadsheets updated manually that are already two weeks out of date. The fleets beating industry benchmarks by 30% in 2026 aren't tracking more — they're tracking smarter. This guide cuts straight to the 8 KPIs, that actually move the needle on fleet cost, uptime, safety, and profitability. See your fleet's KPIs live in a free 30-min FleetRabbit demo →
$2.26Avg cost per mile for medium-duty fleets — up 38% since 2020
5–10%Of annual budgets wasted by average fleets through poor tracking
70%Reduction in unexpected failures with predictive KPI-driven maintenance
30%Performance gap between top-quartile fleets and industry average
The KPI Tier Framework — Not All Metrics Are Equal
Before diving into individual KPIs, understand the tier structure. Top-performing fleets don't treat all metrics equally. They use a three-tier system that separates signal from noise.
Tier 1 · North Star KPIs
Check daily. These 3 numbers tell you if your fleet is healthy or sick — right now.
Cost Per MileFleet Uptime %PM Compliance Rate
▼
Tier 2 · Diagnostic KPIs
Check weekly. These explain why your Tier 1 numbers are moving.
Vehicle UtilisationMTBF / MTTRDriver Safety Score
▼
Tier 3 · Strategic KPIs
Check monthly/quarterly. These guide investment and replacement decisions.
Total Cost of OwnershipFuel Efficiency Trend
The 8 Fleet KPIs That Actually Matter — With 2026 Benchmarks
Each KPI below includes the formula, the 2026 industry benchmark, what the top quartile achieves, and the single most common reason fleets underperform on it.
KPI 01
Cost Per Mile (CPM)
Tier 1 · North Star
The single most telling metric of fleet financial health. CPM converts every cost — fuel, maintenance, depreciation, downtime — into one number per mile driven. If CPM is rising and you don't know why, you're flying blind.
Formula
Total Operating Costs ÷ Total Miles Driven
Why fleets underperform: Fuel tracked separately from maintenance, downtime cost excluded. Most fleets calculate only direct costs — missing 20–30% of true CPM.
Industry avg$0.62/mile
Top quartile<$0.48/mile
Annual gap (40 vehicles)$179K saving
Every $0.01 CPM improvement = $32K/yr on a 40-vehicle fleet at 80K miles/yr
KPI 02
Fleet Uptime %
Tier 1 · North Star
Uptime measures what percentage of scheduled operating time your vehicles are actually available and working. Every point below 95% is revenue lost, deliveries missed, or service disrupted. Most fleets accept 89% as normal — top performers refuse to.
Formula
(Available Hours − Downtime Hours) ÷ Available Hours × 100
Why fleets underperform: Reactive maintenance creates cascading downtime. One unplanned repair triggers a parts wait, technician shortage, and second vehicle being held. Predictive maintenance breaks this chain.
Industry avg89%
Top quartile>95%
1% improvement (40 vehicles)$252K/yr recovered
At $180/hr operational value — each extra uptime percent = 3.65 revenue days/yr per vehicle
KPI 03
PM Compliance Rate
Tier 1 · North Star
The most predictive leading indicator of future breakdowns and cost. Fleets at 94% PM compliance average 0.4 unplanned breakdowns per vehicle per year. Fleets at 71% average 2.8. That's a 7× difference in breakdown frequency from one metric. PM compliance rate today predicts your CPM six months from now.
Formula
PM Services Completed On Time ÷ PM Services Scheduled × 100
Why fleets underperform: Manual scheduling on spreadsheets — PMs get deferred when vehicles are busy. Digital auto-scheduling based on mileage and hours eliminates the human memory dependency.
Industry avg72%
Top quartile>94%
Improvement 72%→85%$1,800–$2,400/vehicle/yr
Planned maintenance costs 3–4× less than reactive repair for the same component failure
KPI 04
Vehicle Utilisation Rate
Tier 2 · Diagnostic
A fleet with 72% utilisation is carrying 28% excess capacity that costs money every day it sits unused — insurance, depreciation, and maintenance on vehicles generating zero revenue. Utilisation problems are often maintenance problems in disguise: vehicles sitting "ready" but actually awaiting parts or a technician.
Formula
Active Operating Hours ÷ Total Available Hours × 100
Why fleets underperform: No real-time visibility of which vehicles are sitting idle vs deployed. Managers discover underutilisation weeks later in reports — too late to redeploy within the same period.
Industry avg71–78%
Top quartile target>90%
Fleet size reduction possibleUp to 30%
Fleets optimising utilisation can operate the same workload with fewer vehicles — direct capital and OpEx reduction
KPI 05
MTBF & MTTR
Tier 2 · Diagnostic
Two sides of the same coin. MTBF (Mean Time Between Failures) tells you how long vehicles run before breaking down — a rising MTBF means your maintenance is working. MTTR (Mean Time To Repair) tells you how fast you recover when they do break down — a falling MTTR means your response is improving. Track both together.
MTBF Formula
Total Operating Hours ÷ Number of Failures
Why fleets underperform: MTBF trending is the most predictive metric — a vehicle whose MTBF is declining 15% quarter-over-quarter needs attention before the breakdown confirms it.
Avg fleet MTBF28 days
Top quartile MTBF40–50 days
Top quartile MTTR40% faster
MTBF below 20 days = reactive maintenance is your primary driver. AI predictive maintenance is the fastest path to improvement
KPI 06
Driver Safety Score
Tier 2 · Diagnostic
Driver behaviour is a CPM driver that most fleets underestimate. A driver whose score drops 20 points over 6 weeks is 3× more likely to have an at-fault accident in the next quarter. Beyond accident risk, aggressive driving — harsh braking, rapid acceleration, excessive idling — adds 15–22% to per-vehicle fuel and maintenance costs.
Why fleets underperform: Coaching happens after incidents, not before. Real-time in-cab alerts during the behaviour change driver habits 5× more effectively than post-trip reviews.
Fleet avg score78 / 100
Top quartile>90 / 100
Fuel savings (avg to top)18–22% reduction
Drivers below 80 receive automatic coaching flag — insurance premium impact if score trends down without intervention
KPI 07
Total Cost of Ownership (TCO)
Tier 3 · Strategic
TCO is the complete cost of a vehicle from acquisition to disposal — including every item most fleet cost reports miss. TCO decides replacement timing: when a vehicle costs more to maintain than to replace, the data tells you before the argument starts. Most fleets have the acquisition cost but lack the downtime cost component — which is almost always the largest gap.
Why fleets underperform: Downtime cost (lost revenue per idle hour) is almost never included. Without it, TCO understates reality by 20–40% for high-utilisation vehicles.
Avg maint cost/mile$0.15–$0.18
Fuel % of total OpEx30–40%
Downtime cost/hour$113–$180/hr
TCO-driven replacement decisions save 35–45% vs keeping over-age vehicles on emotional or budget-cycle reasons
KPI 08
Emergency Parts Ratio
Tier 3 · Strategic
The ratio of emergency parts orders to total parts procurement. This is a proxy metric that tells you, in one number, how well your predictive maintenance and parts forecasting are working. Emergency procurement carries a 35–55% price premium over planned orders. If your ratio is above 20%, you're systematically overpaying for parts.
Formula
Emergency Parts Orders ÷ Total Parts Orders × 100
Why fleets underperform: Parts are ordered reactively after breakdown, not proactively from predictive data. AI parts forecasting moves procurement to before-failure, eliminating emergency premiums.
Industry avg ratio18–25%
Top quartile target<8%
Emergency price premium35–55% overpayment
AI parts forecasting reduces emergency ratio to <8% — eliminating overspend on the same parts competitors buy planned at standard price
Where Does Your Fleet Sit? The 2026 Performance Zone Map
Use this benchmark map to quickly identify which performance zone you're in across each KPI — and where the biggest improvement opportunity lies for your operation.
Every KPI on this page requires the same thing: accurate, real-time data flowing from vehicles to a dashboard without manual entry. FleetRabbit connects to your existing telematics (200+ providers) and builds your KPI baseline within 72 hours of setup.
Live CPM DashboardCost per mile calculated continuously per vehicle — fuel, maintenance, and downtime cost all included. Vehicles running 25%+ above fleet-average CPM flagged automatically.
Automated PM SchedulingPM work orders triggered by mileage, engine hours, or calendar interval — compliance rate tracked and reported without manual counting. Missed PM escalation within 4 hours.
Driver Safety ScoringPer-driver composite score updated after every journey. In-cab coaching alerts at moment of behaviour. Manager escalation triggered for drivers below 80 or declining trend.
Utilisation & Idle TrackingReal-time vehicle status — deployed, idle, or in maintenance. Idle vehicles flagged for redeployment or disposal review. Fleet availability score calculated and trended.
MTBF / MTTR TrendingVehicle MTBF trended over 12 months — declining trend triggers predictive alert before the breakdown confirms it. MTTR tracked by fault type to identify systemic repair bottlenecks.
Parts Demand ForecastingAI predicts parts needs from vehicle age, mileage, and failure patterns — auto-triggering reorders before stockouts. Emergency parts ratio tracked and targeted to <8%.
Your Fleet's KPI Baseline — In 72 Hours
Connect FleetRabbit to your existing telematics and see your actual cost per mile, uptime percentage, PM compliance rate, and driver scores against 2026 industry benchmarks. No manual data entry. No spreadsheet formulas. Just your fleet's real numbers.
Which fleet KPIs should I track first if I'm just starting out?
+
Start with the three Tier 1 "North Star" KPIs: Cost Per Mile (CPM), Fleet Uptime %, and PM Compliance Rate. These three numbers tell you almost everything about your fleet's financial health, operational reliability, and maintenance discipline. Once these are stable and trending in the right direction, add the Tier 2 diagnostic KPIs (Utilisation, MTBF/MTTR, Driver Safety) to explain why your North Star numbers are moving. Trying to track all 8 at once usually results in tracking none of them well.
How often should fleet KPIs be reviewed?
+
It depends on the tier. Tier 1 North Star KPIs (CPM, Uptime, PM Compliance) should be checked daily on a dashboard — these are your early-warning system. Tier 2 Diagnostic KPIs (Utilisation, MTBF/MTTR, Driver Safety) are best reviewed weekly to spot trends. Tier 3 Strategic KPIs (TCO, Emergency Parts Ratio) should be analysed monthly or quarterly to guide replacement, procurement, and budgeting decisions. Book a FleetRabbit demo to see how automated dashboards remove the manual effort from this cadence.
What's the fastest way to lower Cost Per Mile?
+
The fastest lever is almost always improving PM Compliance Rate. Fleets moving PM compliance from 72% to 85% typically save $1,800–$2,400 per vehicle per year because planned maintenance costs 3–4× less than reactive repair. The second-fastest lever is driver coaching — reducing harsh braking, speeding, and idling can cut fuel and maintenance costs by 15–22%. Both require real-time data, not month-old spreadsheets. Start FleetRabbit free to automate both tracking systems.
What does "top quartile" mean in the 2026 benchmarks?
+
Top quartile refers to the top 25% of fleets in the benchmark dataset for each KPI. For example, a top-quartile fleet has CPM under $0.48/mile, uptime above 95%, and PM compliance above 94%. The gap between industry average and top quartile is typically a 30% performance difference — which translates to $100K–$300K per year for a 40-vehicle fleet. Reaching top quartile isn't about working harder; it's about tracking the right metrics with real-time data and acting on them early.
Do I need expensive telematics hardware to track these KPIs?
+
No. FleetRabbit connects to 200+ existing telematics providers, so if your vehicles already have ELDs or GPS trackers, your KPI baseline can be built in 72 hours without buying new hardware. For fleets without telematics, entry-level devices start under $20/month per vehicle. The bigger cost of not tracking these KPIs is the 5–10% of annual budget that average fleets waste through poor visibility — far more than any hardware investment. Schedule a demo to see how your existing setup can feed directly into a live KPI dashboard.