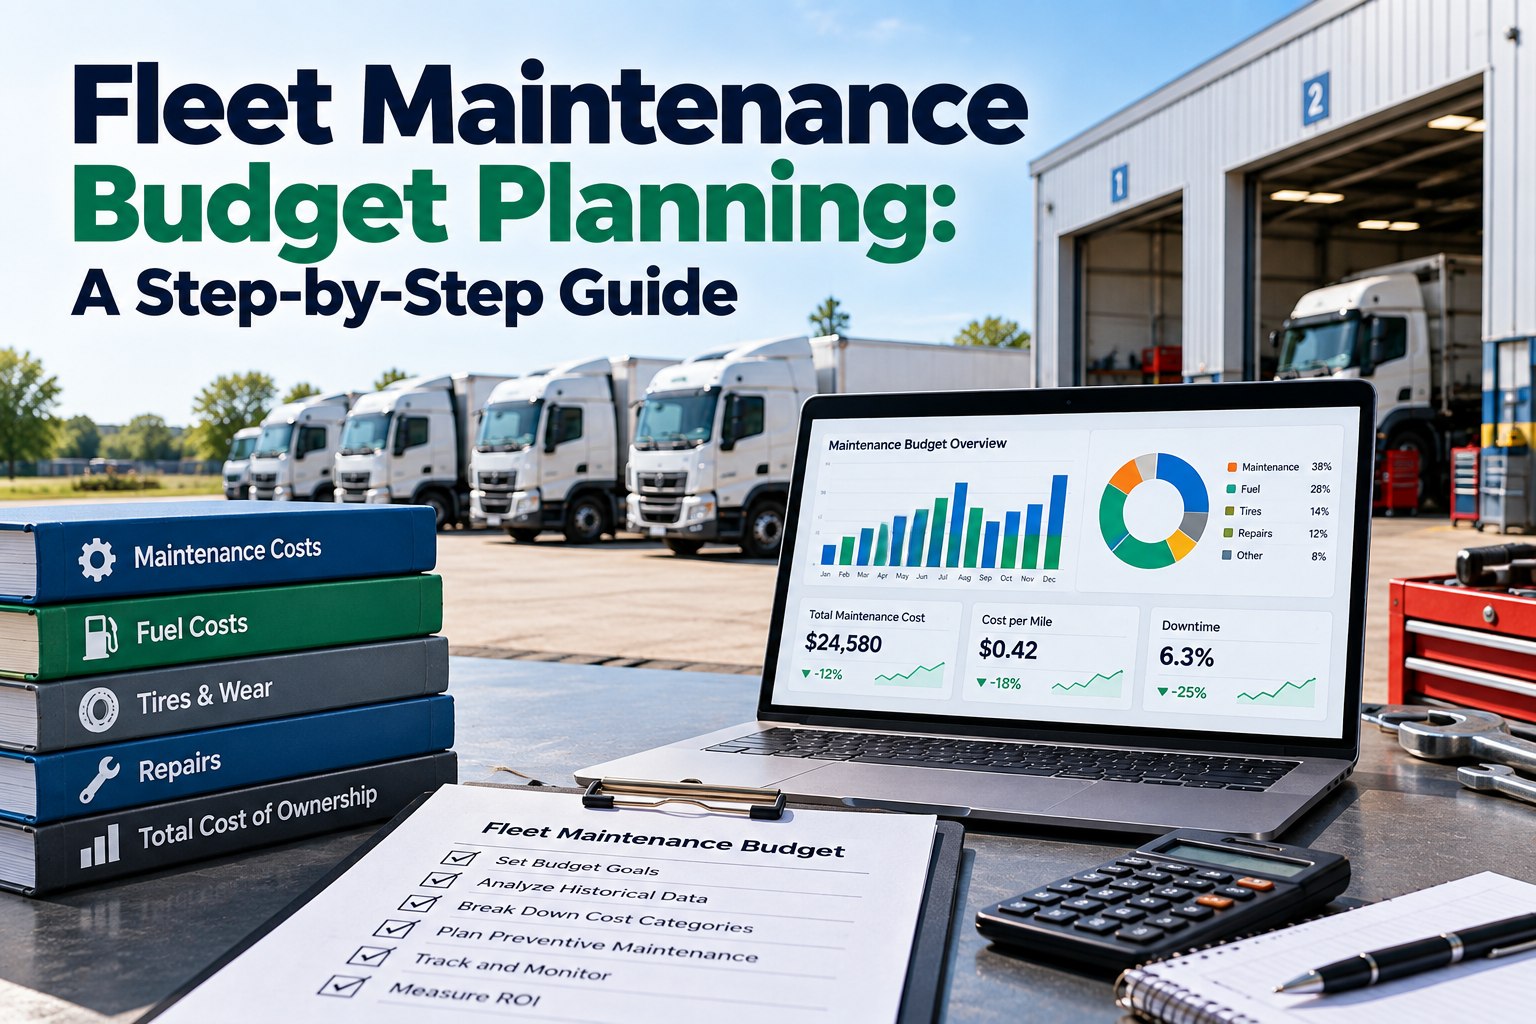
A fleet maintenance budget is the amount you expect to spend keeping vehicles safe and running over a year, built from three things: how many miles you'll run, what a mile of repair and tire cost really costs you, and a reserve for what you can't predict. The simplest working formula is miles × cost per mile, plus a contingency and an inflation buffer. This guide walks that formula step by step with a worked 20-truck example, shows where the benchmarks come from and how to read them, and ends with the monthly routine that keeps actual spend within a few percent of plan. If you'd rather start from numbers, use our truck maintenance cost calculator template or pull your last 12 months of cost per mile free.
2026 BUDGET GUIDE · STEP BY STEP
Turn Last Year's Repair History Into Next Year's Budget
Costs are rising on three fronts at once: repairs, tires and fuel. This guide turns your own maintenance and fuel history into a budget you can defend, then shows how to track it monthly so surprises show up early.
KEY TAKEAWAY
Annual budget = (miles × cost per mile) + contingency + inflation buffer
Start from your own cost per mile over the last 12 to 24 months. Use industry averages only to check that your number is believable.
The 2026 Cost Baseline: Know the Numbers Before You Budget
Before you set a number, look at what the industry is spending and where it is moving. The American Transportation Research Institute's latest operational-costs data puts repair and maintenance at about 21.5 cents per mile and tires at about 5 cents per mile for the average carrier, with repair and maintenance up 8.6% in a year, according to Trucking Info's coverage of the report. Against a total cost of $2.336 per mile, repair and maintenance is roughly 9% of operating cost, and tires add about 2% more.
21.5¢/mi
Average repair and maintenance cost per mile
5¢/mi
Average tire cost per mile, up 6.4%
+8.6%
Rise in repair and maintenance cost in a year
+45%
Rise in repair and maintenance cost per mile since 2019
Fuel is the other moving part. Diesel was reported at $3.74 a gallon in August 2025 and $5.35 in August 2026, which at 8 mpg adds about 20 cents per mile, per Fleet Maintenance's summary of the same ATRI data. That is why a flat copy of last year's budget is risky, and why the formula below carries an explicit inflation buffer.
A maintenance budget is four numbers added together. Each one has a source you can pull from your own records.
Seven Steps to Build the Budget
STEP 1
Gather 12 to 24 months of history
Collect every work order, invoice, tire purchase and fuel receipt by vehicle. Two years smooths out one-off events like a major component failure.
STEP 2
Compute cost per mile by vehicle
Total maintenance and tire cost divided by miles driven, for each unit and for the fleet. The spread between your best and worst vehicles is where the savings live.
STEP 3
Split planned from unplanned spend
Label each cost as scheduled PM, forecastable repair or emergency repair. The planned-to-reactive ratio is the single best predictor of whether next year's budget will hold.
STEP 4
Adjust for vehicle age
Older units cost more per mile. Budget by age bracket, not a single fleet average, so one ageing truck doesn't distort the plan.
STEP 5
Forecast the big components
Clutches, suspension, aftertreatment and major tire replacements fall due at predictable mileages. Put them in the months they're expected, not in the contingency.
STEP 6
Set contingency and inflation buffers
Hold a reserve for unplanned failures and a separate allowance for price increases, so overruns are visible as one or the other.
STEP 7
Track monthly against the plan
Compare actual to budget by vehicle every month, and investigate any unit that drifts. A budget you only look at once a year is a forecast, not a control.
A Worked 20-Truck Example
Here is the formula applied to a 20-truck fleet. The inputs are assumptions chosen for the example: 90,000 miles per truck, the ATRI averages for repair and maintenance and tires, a 10% contingency and a 5% inflation buffer. Swap in your own measured figures. Swipe the table horizontally on mobile.
← Swipe to see all columns →
How the $548,550 splits
Repair and maintenance (70.5%)
Tires (16.4%)
Contingency $47,700 (8.7%)
Inflation $23,850 (4.4%)
Your cost per mile is already in your records.
FleetRabbit turns work orders, parts, tires and fuel into cost per mile by vehicle, so step 2 takes minutes instead of a spreadsheet project.
The Age Curve: Where Ageing Trucks Quietly Eat the Budget
A single fleet-wide cost per mile hides the fact that older vehicles cost more to keep running. One published rule of thumb from FreightWaves puts newer trucks at roughly 10 to 12 cents per mile, mid-life trucks at 13 to 16 cents and older trucks at 17 to 22 cents. These are rough ranges, and the exact figures vary by duty cycle and spec, but the shape is the point: cost per mile climbs with age.
Typical repair and maintenance cost per mile by vehicle age (rule of thumb)
Replace-review zone
$0.25+
$0.00$0.10$0.20$0.30
Compare these with the 21.5¢ fleet average from ATRI. A fleet average above the new-truck range usually means older units are carrying the budget.
Repair or Replace: The Threshold Test
Every fleet has a truck that keeps going back to the shop. The question is when repairing it stops making sense. Two simple tests flag the candidates, both common rules of thumb rather than fixed standards.
TEST 1
Maintenance-to-value ratio
Annual maintenance ÷ current market value
When this passes roughly 40–45%, the truck is a replacement candidate. Example: $18,000 of maintenance on a truck worth $40,000 is 45%.
TEST 2
Cost per mile against the fleet
Unit cost per mile vs fleet average
A unit running well above your fleet average, or above about 25 cents per mile, deserves a replace-or-repair review rather than another invoice.
Spot Your Worst Trucks Before They Blow the Budget
FleetRabbit ranks vehicles by cost per mile, tracks PM compliance and keeps every work order tied to the unit, so the trucks that need a replacement review stand out. Free for up to three vehicles, then $5 per vehicle per month, with no hardware to buy.
Cost per mile by unit
PM scheduling
Work order history
Fuel tracking
Six KPIs That Make the Budget Real
A budget is only as good as the measures behind it. These six numbers show whether you are on plan and why.
Cost per mile
Maintenance and tire spend ÷ miles, by unit and fleet
PM compliance %
Services completed on or before due ÷ services due
Planned vs reactive ratio
Scheduled work as a share of all maintenance spend
Vehicle availability
Days in service ÷ days scheduled
MTBF and MTTR
Mean time between failures, and mean time to repair
First-time fix rate
Repairs that don't come back within a set window
The Hidden Costs the Invoice Doesn't Show
Parts and labor are only part of what maintenance costs. Downtime, towing, late deliveries and the administrative time to manage repairs rarely appear on the repair invoice, but they often matter more. Price the biggest one first.
Downtime cost
Days out of service × revenue per truck per day
Example: a truck out for 3 days that earns $1,000 a day costs $3,000 in lost revenue, on top of the repair itself. Track this alongside repair cost, and budget downtime as its own line.
The Monthly Review Routine That Keeps You Within Budget
The budget only works if someone looks at it on a schedule. This three-tier routine catches drift while it is still small.
Monthly
- Actual vs budget, by vehicle
- Investigate any unit over its plan
- Check PM compliance and overdue services
- Log contingency used and why
Quarterly
- Re-forecast the remaining months
- Refresh age-bracket cost per mile
- Review the planned-to-reactive ratio
- Flag replacement candidates
Annually
- Rebuild the budget from 12 to 24 months of history
- Reset contingency and inflation buffers
- Plan next year's replacements
- Review tire and parts pricing
Frequently Asked Questions
How much should I budget for fleet maintenance per vehicle?
Start from your own cost per mile and expected miles. As a check, ATRI's average of about 21.5 cents per mile for repair and maintenance plus about 5 cents for tires works out to roughly $24,000 per truck at 90,000 miles. Published per-vehicle ranges vary widely by vehicle class and duty cycle, so treat them as a sanity check and
review your own per-vehicle numbers with our team.
What percentage of operating costs should maintenance be?
Using ATRI's averages, repair and maintenance is roughly 9% of total operating cost per mile, with tires adding about 2%. Many industry guides cite a similar 8 to 9% range. Your share will be higher if your fleet is older or runs in harsher conditions.
How do I calculate a fleet maintenance budget?
Multiply planned miles by your historical cost per mile, then add a contingency for unplanned repairs and a buffer for price increases. The worked example above shows the full arithmetic for a 20-truck fleet, and our
step-by-step budget guide goes deeper on the history-gathering stage.
How big should the contingency reserve be?
Many guides suggest 10 to 15% of the base budget, with the number set by how reactive your maintenance is today. A fleet with mostly planned work and a stable age profile can hold less. A fleet with many older units or a high reactive share should hold more, and shrink it as the ratio improves.
Does preventive maintenance really lower the budget?
Planned work is cheaper per event than an emergency repair, because it avoids towing, downtime and rushed parts. The size of the saving depends on your fleet, so measure it: track your planned-to-reactive ratio and cost per mile over a few quarters, and you can
set up PM schedules on three trucks free to see the effect.
When should I replace a truck instead of repairing it?
Common triggers are annual maintenance above roughly 40 to 45% of the vehicle's market value, or a cost per mile well above your fleet average. Use them as flags for review, not automatic rules, since resale value, downtime and upcoming major repairs all matter.
How often should I review the budget?
Monthly for actual versus plan by vehicle, quarterly for a re-forecast, and annually for a full rebuild. The monthly check is the one that stops a small overrun from becoming a large one.
Turn Your Maintenance History Into a Budget You Can Defend
Your cost per mile, planned-to-reactive ratio and worst-performing vehicles are all sitting in your work orders and fuel records. Start with three vehicles for free and see them in one dashboard.
Free tier for up to 3 vehicles · No credit card required · No hardware installation
October 2, 2026By Alex Rowan
All Blogs