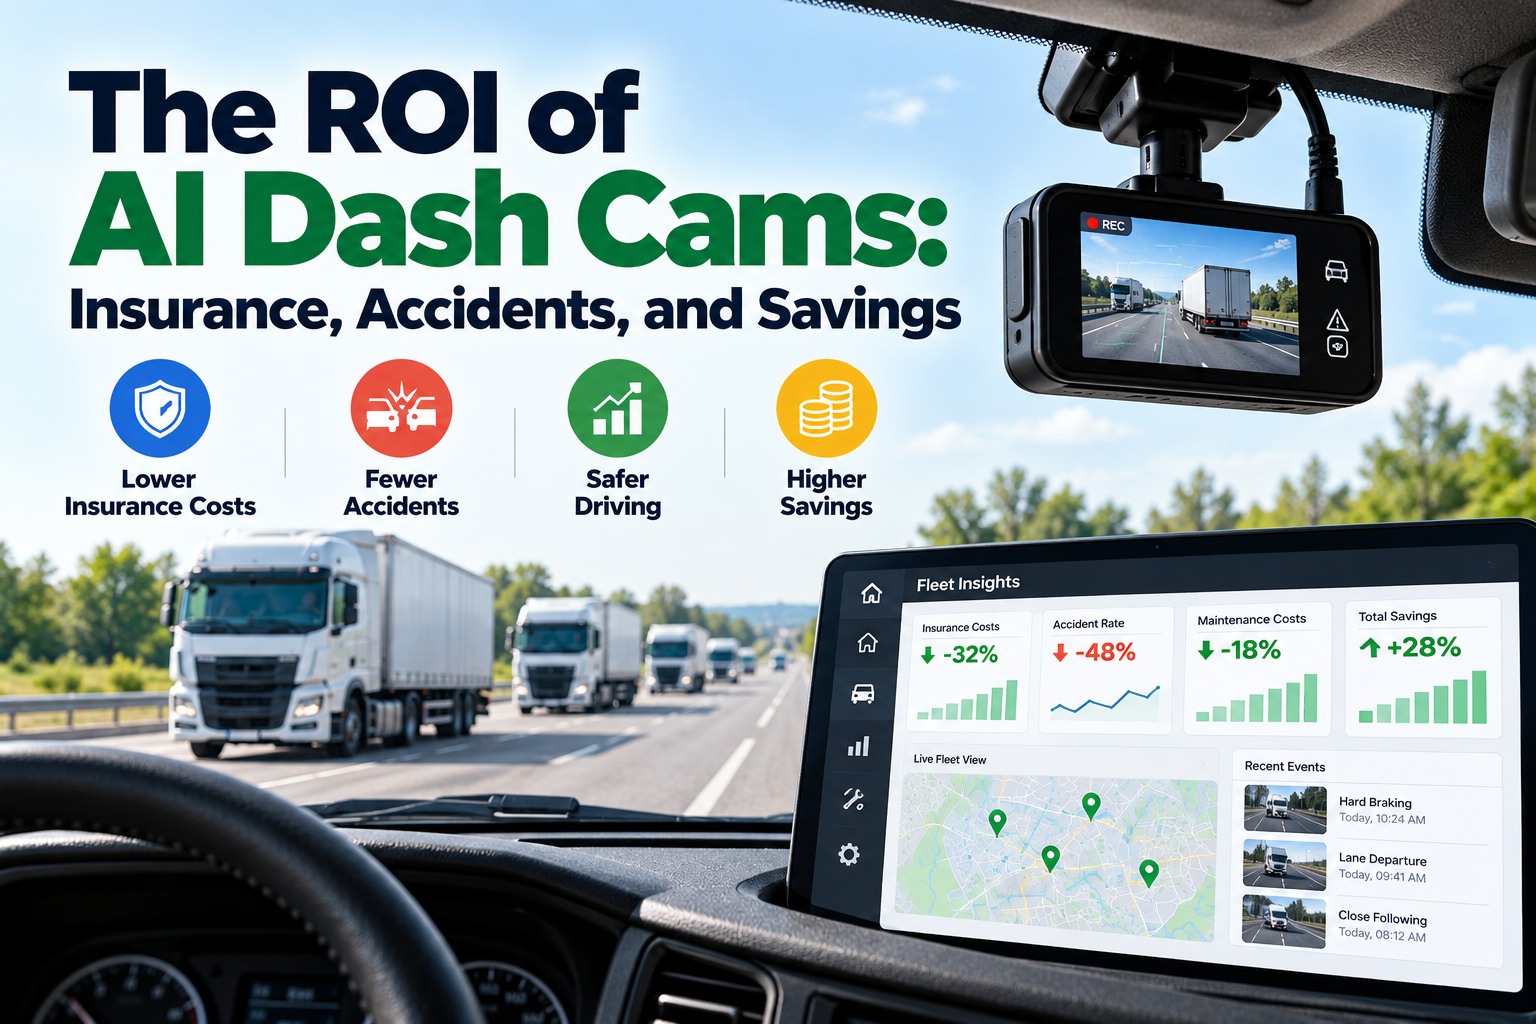
The return on an AI dash cam program comes down to one comparison: what the cameras and the coaching around them cost each year, against the crashes, claims and premium dollars they help you avoid. The formula is (crash costs avoided + claim savings + insurance savings) minus (hardware + subscription + coaching time), divided by that cost. This guide prices both sides with sourced figures, shows what the research does and doesn't prove, and gives you a break-even grid so you can see how few avoided crashes it takes to pay for a 30-vehicle program. If you want the insurance angle first, read our guide to fleet insurance and telematics, or start tracking your fleet's cost per mile free to get your baseline.
AI DASH CAM ROI · FOR SAFETY & FLEET MANAGERS
Cameras Don't Pay Back. Coaching Does.
Cameras don't pay back on their own. Coaching does. This is the manager's guide to the real math: what a program costs, what the research supports, and how many avoided crashes it takes to break even.
30-VEHICLE SNAPSHOT · ILLUSTRATIVE
Year-one cost$31,420
Ongoing cost per year$20,920
Break-even at $30K per crash~1 crash
Assumptions and arithmetic are shown below. Replace them with your own.
The Ledger: What It Costs and Where It Pays Back
An honest ROI starts by listing both columns. The cost side is concrete and easy to price. The benefit side has more variables, which is why the rest of this guide measures it rather than assuming it.
COST SIDE · 30 vehicles, year one
Hardware, dual-facing at ~$350$10,500
Subscription at $35 a month$12,600
Coaching time, 4 hrs a week at $40$8,320
Self-install$0
Year-one total$31,420
Ongoing per year (no hardware)$20,920
BENEFIT SIDE · where the money shows up
Fewer crashes. Less risky driving means fewer repairs, injuries and out-of-service days.
Faster, cheaper claims. Video shows what happened, which helps close disputed claims and defend against false ones.
Insurance conversations. Documented controls give your broker something to price. Discounts vary by insurer and are never guaranteed.
Downtime avoided. Every crash you prevent is a truck that stays on the road.
Hardware and subscription ranges come from SureCam's fleet dash cam cost guide: $200–$400 for a forward-facing unit, $250–$450 for dual-facing, $500–$1,000 for multi-camera, and $25–$100 per vehicle per month for subscriptions. The coaching line is our assumption. Real programs vary widely, so price your own.
What a crash can cost: the severity ladder
Average cost per large-truck crash in 2023 dollars, from
FMCSA's crash cost methodology. These are full societal costs, not what a carrier pays out of pocket, and bar lengths are not to scale. Use them to see the range, then estimate your own carrier-borne cost per crash for the math below.
Your cost per crash is the number that decides everything.
Pull repair, downtime, claim and premium cost for your last few incidents. FleetRabbit keeps maintenance, downtime and cost per mile together so that history is one report.
What the Research Actually Shows
The evidence that video-based monitoring changes driver behavior is real, but it is narrower than marketing suggests. Here is what each source measured, and what it did not.
FMCSA-sponsored guidance · onboard safety monitoring
52.2%
fewer safety-related events per 10,000 miles, and 59.1% fewer of the most severe events
Measures risky events, not crashes. Only video-based coaching worked: an in-cab feedback light alone, or coaching without video, was not enough. See
FMCSA's guidance document.
VTTI field test · commissioned by a video-safety vendor
37–52%
reduction in risky driving across two fleets, and a 75% drop in near-miss events
The same research projected about 35% fewer collisions if all U.S. heavy trucks and buses adopted video monitoring. That is a model, not a measured result. Summarized by
CCJ.
What both point to
Coaching
is the active ingredient. The camera captures the event, but a manager has to review it and talk to the driver
The FMCSA guidance also found programs work better when they recognize safe driving, not only mistakes, and when drivers help design them.
The Break-Even Grid
Instead of guessing a savings percentage, ask how many crashes the program has to prevent to pay for itself. Divide the cost by what a crash costs you. The grid uses the $31,420 year-one cost and $20,920 ongoing cost from the ledger. Swipe the table horizontally on mobile.
← Swipe to see all columns →
Now a sensitivity check. Assume the 30-vehicle fleet has 4 crashes a year at $30,000 each, and look at three levels of crash reduction. The reductions are assumptions, chosen to sit below the research figures because those measure risky events, not crashes.
← Swipe to see all columns →
The table is deliberately conservative. It counts only avoided crashes. It leaves out claim defense, faster claim closure, insurance conversations and downtime, all of which add to the benefit side. It also shows the honest downside: at a 20% reduction, year one is negative because hardware is a one-time cost. The program has to hold up for more than one year to be judged fairly.
See Safety, Maintenance and Cost Per Mile Together
A dash cam shows you the event. FleetRabbit connects it to the rest of the fleet picture: inspections, work orders, downtime and cost per mile for each vehicle, so you can see what an incident really cost. Free for up to three vehicles, then $5 per vehicle per month.
Cost per mile by unit
Downtime tracking
Digital DVIR
AI dashcam program
Four Ways Dash Cam ROI Quietly Fails
Most failed programs fail for the same reasons. Each one is fixable before you buy.
Cameras without coaching
If nobody reviews events and talks to drivers, you've bought a recorder, not a safety program. Budget the coaching hours in the cost side, as the ledger does.
Punishment only
Programs that only flag mistakes get resisted. Recognize safe driving too, as the FMCSA guidance recommends, and drivers are more likely to engage.
Drivers left out of the design
A driver-facing camera is a sensitive change. Explain what is recorded, who sees it and how long it is kept, and involve drivers in setting goals before rollout.
No baseline to compare against
Without last year's incident rate, claim cost and cost per mile, you can't show a result. Capture the baseline first, then the program has something to beat.
Choosing the Camera: What Each Type Costs
Camera type changes both the price and the evidence you get. Prices below are typical hardware ranges before any subscription. Swipe the table horizontally on mobile.
← Swipe to see all columns →
A 90-Day Pilot That Proves the ROI
You don't need to equip the whole fleet to learn whether it pays. Pilot on a slice, measure, then decide.
DAYS 1–30
Baseline and install
Record last year's incidents, claim costs and cost per mile. Install on your highest-risk units and brief the drivers on what is recorded and why.
DAYS 31–60
Coach with video
Review flagged events weekly, share clips with drivers one to one and call out good driving as often as risky driving.
DAYS 61–90
Measure and decide
Compare events per 10,000 miles, incidents and claim cost against the baseline, then use the break-even grid to decide whether to expand.
The Scorecard: What to Measure
These measures turn "it feels safer" into evidence you can show finance and your insurer. Swipe the table horizontally on mobile.
← Swipe to see all columns →
Frequently Asked Questions
What is the ROI of AI dash cams for fleets?
It depends on your crash rate, your cost per crash and how well you coach. The worked example in this guide shows a 30-vehicle program costing about $31,420 in year one and $20,920 after, which one or two avoided crashes at $30,000 each can cover.
Run the break-even on your own numbers to see where you land.
How much do fleet dash cams cost?
Published ranges put hardware at about $200 to $1,000 per camera depending on type, plus $25 to $100 per vehicle per month for the subscription, according to SureCam's cost guide. Add the time your team spends reviewing and coaching, which is often the largest hidden cost.
Do AI dash cams actually reduce accidents?
Research on video-based monitoring found large reductions in risky driving events, in one FMCSA-referenced study 52.2% fewer per 10,000 miles. Those studies measure events and behavior, not crashes directly, and they found the effect depended on coaching with video. Expect results to track how seriously your team coaches.
Do dash cams lower fleet insurance premiums?
Some insurers offer programs or favorable terms for fleets with documented safety controls, but discounts vary by insurer, fleet and loss history, and none are guaranteed. Ask your broker what evidence they want, and see our guide to
reducing fleet insurance costs with telematics.
Will drivers accept a driver-facing camera?
Acceptance is the main implementation risk. FMCSA's guidance found drivers held positive views when programs were fair, recognized safe driving and involved them in setting goals. Be open about what is recorded, who can see it and how long it is stored.
How long until a dash cam program pays for itself?
It depends on how soon the program prevents a costly incident, so payback can range from months to well over a year. Hardware is a one-time cost, so the first year looks worst, which is why the 90-day pilot and the break-even grid are better guides than a single payback claim.
How does FleetRabbit fit in, and can I try it first?
FleetRabbit pairs AI dashcam safety with maintenance, downtime and cost per mile in one platform, so you can see what incidents and repairs cost per vehicle. The platform is free for up to three vehicles with no credit card, then $5 per vehicle per month, so you can
baseline three vehicles first before deciding on cameras.
Put a Number on Your Dash Cam Payback
Know your cost per crash, your baseline and your break-even before you buy a single camera. Start with three vehicles for free and see cost per mile and downtime in one dashboard.
Free tier for up to 3 vehicles · No credit card required · No hardware installation for the platform
October 2, 2026By Sam Parker
All Blogs