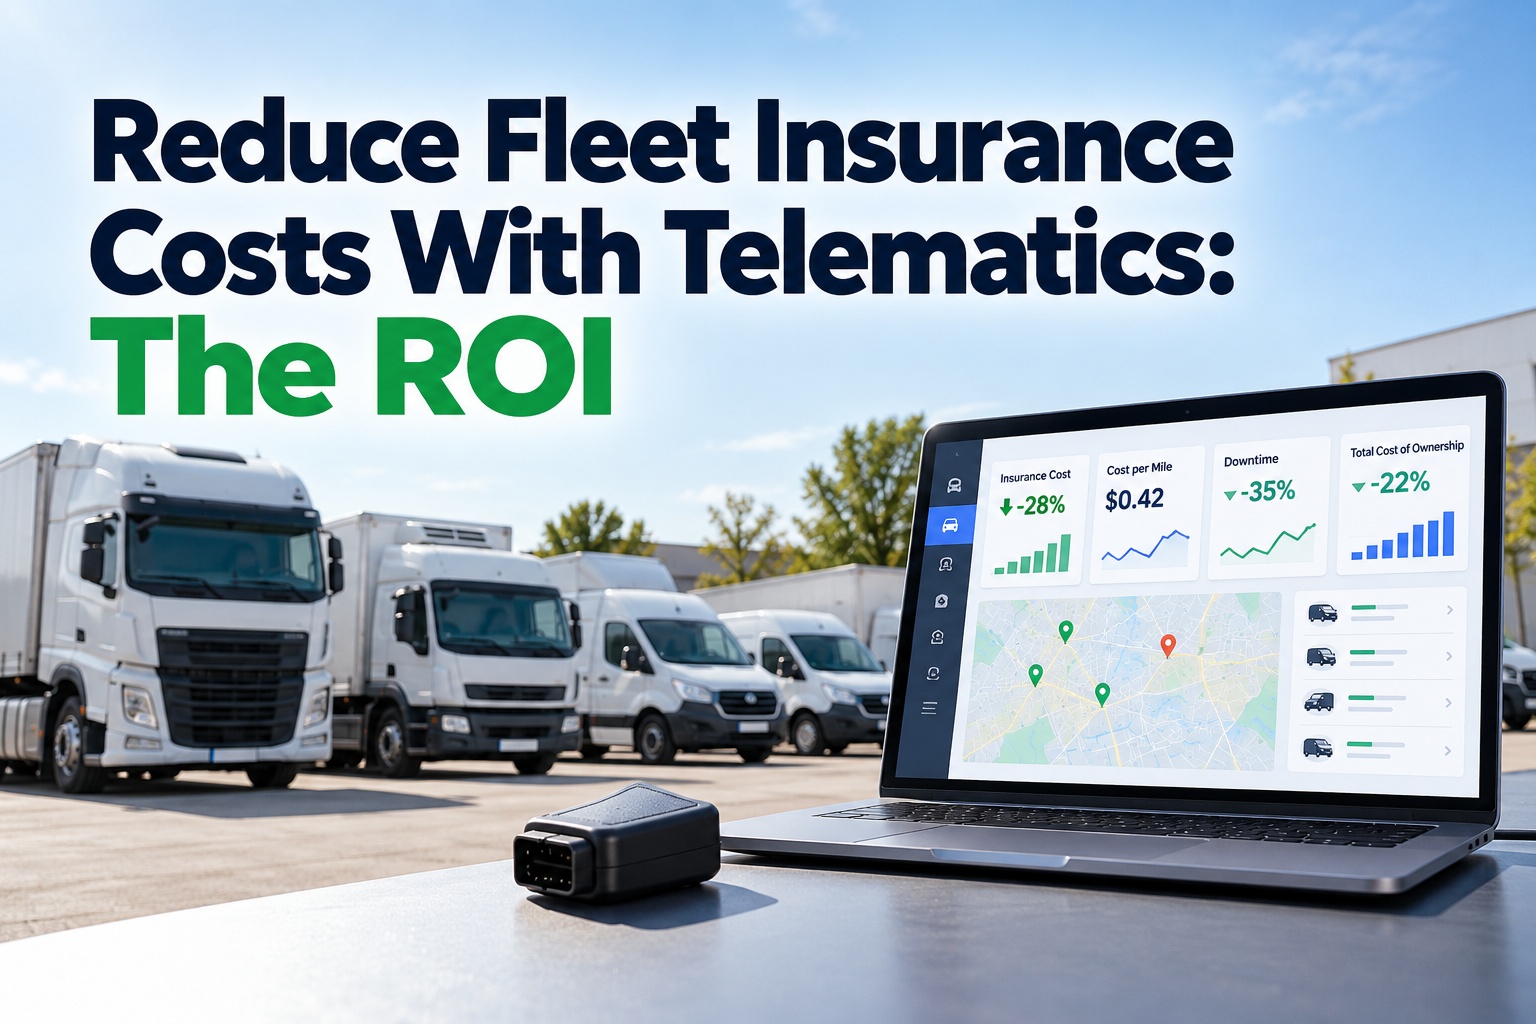
Fleet insurance is one of the few big operating costs that fleets still treat as a fixed bill. It isn't. Insurers price risk from evidence, and a fleet that can show clean inspection records, on-time preventive maintenance, closed defects and verified driving data walks into renewal with a stronger case than one that can't. According to the American Transportation Research Institute, liability and cargo insurance now costs the average carrier about $0.11 per mile. This guide puts hard numbers behind that: what a realistic insurance saving looks like, which fleet data moves it, and how to measure the return against what the software costs. Start a free trial or book a demo to see your own cost-per-mile and downtime in one dashboard.
FLEET INSURANCE ROI · FOR FLEET & SAFETY MANAGERS
Reduce Fleet Insurance Costs With Telematics: The ROI
Insurers reward fleets that can prove how they operate. This is the manager's guide to the savings math: what the premium really costs per mile, which data points underwriters care about, and how to show the payback before you spend a dollar.
THE BASELINE
Insurance Is Already a Per-Mile Cost. Treat It Like One.
ATRI's latest operational-costs report puts total trucking cost at a record $2.336 per mile, with insurance premiums averaging $0.11 per mile and rising 3.9% year over year. At that rate, a single truck running 100,000 miles a year carries roughly $11,000 of insurance cost. Even a small percentage reduction becomes real money across a fleet, which is why the question to ask is not "what is our premium" but "what evidence do we bring to renewal."
$0.11/mi
Average insurance premium cost per mile (ATRI)
$2.336/mi
Record total operating cost per mile
~$11,000
Insurance cost per truck at 100,000 miles a year
Four Data Levers That Move a Premium
Underwriters price risk. Anything that credibly lowers your claims frequency or severity, and that you can show on paper, strengthens your hand. These are the four categories of fleet data that matter most, and none of them require guesswork.
1
Driver behavior and location data
Speeding, harsh braking and route patterns are the classic telematics signals, and usage-based and telematics-linked programs price them directly. Many insurers offer discounts for fleets that share this data, though the size of the discount varies by carrier, fleet and program. Ask your broker which programs they accept.
2
Inspection records that actually exist
Complete pre-trip and post-trip DVIRs, timestamped and retained, show that defects are found before they become roadside events. Paper that is lost or illegible helps no one at renewal or after a claim.
3
Preventive maintenance completed on schedule
Brakes, tires and steering are claim-relevant. A history of PMs done at the right mileage, with work orders closed, is concrete evidence that the equipment side of your risk is managed.
4
Defect-to-repair traceability
When a driver reports a defect, the record should show who saw it, when it was repaired and who signed off. That chain protects you after an incident, because it shows the vehicle was not knowingly run with an open safety defect.
Walk into renewal with records, not recollection.
FleetRabbit keeps inspections, work orders, maintenance history and cost-per-mile in one place, so the evidence is ready when your broker asks for it.
The Savings Math: A Worked Example
Here is what the arithmetic looks like. The table uses ATRI's $0.11-per-mile average and an assumed 100,000 miles per truck per year. These are illustrative scenarios, not promised results. Your own premium, miles and program terms will differ, and actual discounts depend on your insurer. Swipe the table horizontally on mobile.
← Swipe to see all columns →
Read the 25-truck row: a 10% premium reduction is $27,500 a year against about $1,500 of software cost, before counting the free tier for the first three vehicles. Even the 5% scenario covers the software roughly nine times over. The point is not that every fleet will hit these numbers. It is that the break-even is low enough that a modest improvement pays for the whole program.
Five Numbers to Put in Front of Your Broker
A premium negotiation goes better with a dashboard than with a story. These are the five numbers worth having ready, and all of them come from data you already generate.
1
Cost per mile by vehicle and by fleet, trended over 12 months
2
Inspection completion rate: share of required DVIRs actually completed
3
PM compliance: percent of services done on or before due
4
Unplanned downtime: days out of service from breakdowns, by cause
5
Defect close time: average hours from reported defect to signed-off repair
6
Total cost of ownership per unit, so ageing, costly vehicles are visible
See Your Cost Per Mile and Downtime in One Dashboard
FleetRabbit brings maintenance, inspections, fuel and cost-per-mile together so the numbers above are a report, not a spreadsheet project. Free for up to three vehicles, then $5 per vehicle per month, with no hardware to buy.
Cost per mile
Downtime tracking
Digital DVIR records
Free for 3 vehicles
Before and After: What Changes at Renewal
The difference is less about the discount itself and more about how prepared you are when the conversation starts. Swipe the table horizontally on mobile.
← Swipe to see all columns →
A 30-Day Plan to Be Renewal-Ready
You don't need a long implementation to start building evidence. This is a realistic order of operations for a fleet that begins about a month before renewal.
1
Week 1: Load your vehicles and baseline the numbers
Add your units, import recent maintenance history and capture your starting cost per mile and downtime so you can show change later.
2
Week 2: Move inspections to digital DVIR
Switch drivers from paper to mobile pre-trip and post-trip checks so every inspection is timestamped and kept.
3
Week 3: Schedule PMs and close open defects
Set mileage or hour-based service intervals and clear any backlog of open defects, because an old, unresolved defect is the first thing an adjuster looks for.
4
Week 4: Pull the report and brief your broker
Export the five numbers above, share them with your broker early and ask which discounts or programs they can apply to a fleet with documented controls.
Frequently Asked Questions
How much can telematics reduce fleet insurance costs?
It varies by insurer, fleet and program, and any single percentage quoted without those details should be treated cautiously. The table above shows 5%, 10% and 15% scenarios so you can see the dollar impact at each level. The practical step is to ask your broker which telematics or usage-based programs they accept and what evidence they want, then
book a demo to see which of those records FleetRabbit can produce.
Does maintenance data really affect an insurance quote?
It affects the story you can tell. Underwriters and adjusters look for evidence that equipment is maintained and defects are fixed, especially after an incident. Complete, timestamped records are far stronger than paper that may be missing, and they are also the records a regulator can ask for.
What is the average fleet insurance cost per mile?
ATRI's latest operational-costs report puts liability and cargo insurance at about $0.11 per mile, up 3.9% from the prior year. Your figure depends on your lanes, cargo, loss history and coverage limits, so compare it to your own total premium divided by annual miles.
Do I need new hardware to start?
Not to begin collecting inspection, work-order and maintenance records. Those run on the smartphones your team already has. If you also want GPS or telematics data in the picture, FleetRabbit can integrate with the devices you already use, and you can
book a demo to review your setup.
How do I calculate my own insurance savings?
Divide your annual premium by total fleet miles to get a cost per mile. Multiply your premium by the percentage reduction you expect, then subtract the annual software cost. For example, a $275,000 premium with a 10% reduction is $27,500, minus $1,500 of software, for a net of $26,000.
What does FleetRabbit cost, and can I trial it first?
FleetRabbit is free for up to three vehicles with no credit card, then $5 per vehicle per month with no hardware and no setup fee. That makes it easy to run a pilot on a few trucks and see the numbers before you decide, and you can
start a free trial in minutes.
Put a Number on Your Insurance Savings
Better records give you a stronger renewal conversation, and a stronger conversation is where fleet insurance savings come from. Start with three vehicles for free, and see your cost per mile, downtime and maintenance history in one dashboard.
Free tier for up to 3 vehicles · No credit card required · No hardware installation
October 2, 2026By Emily Parker
All Blogs