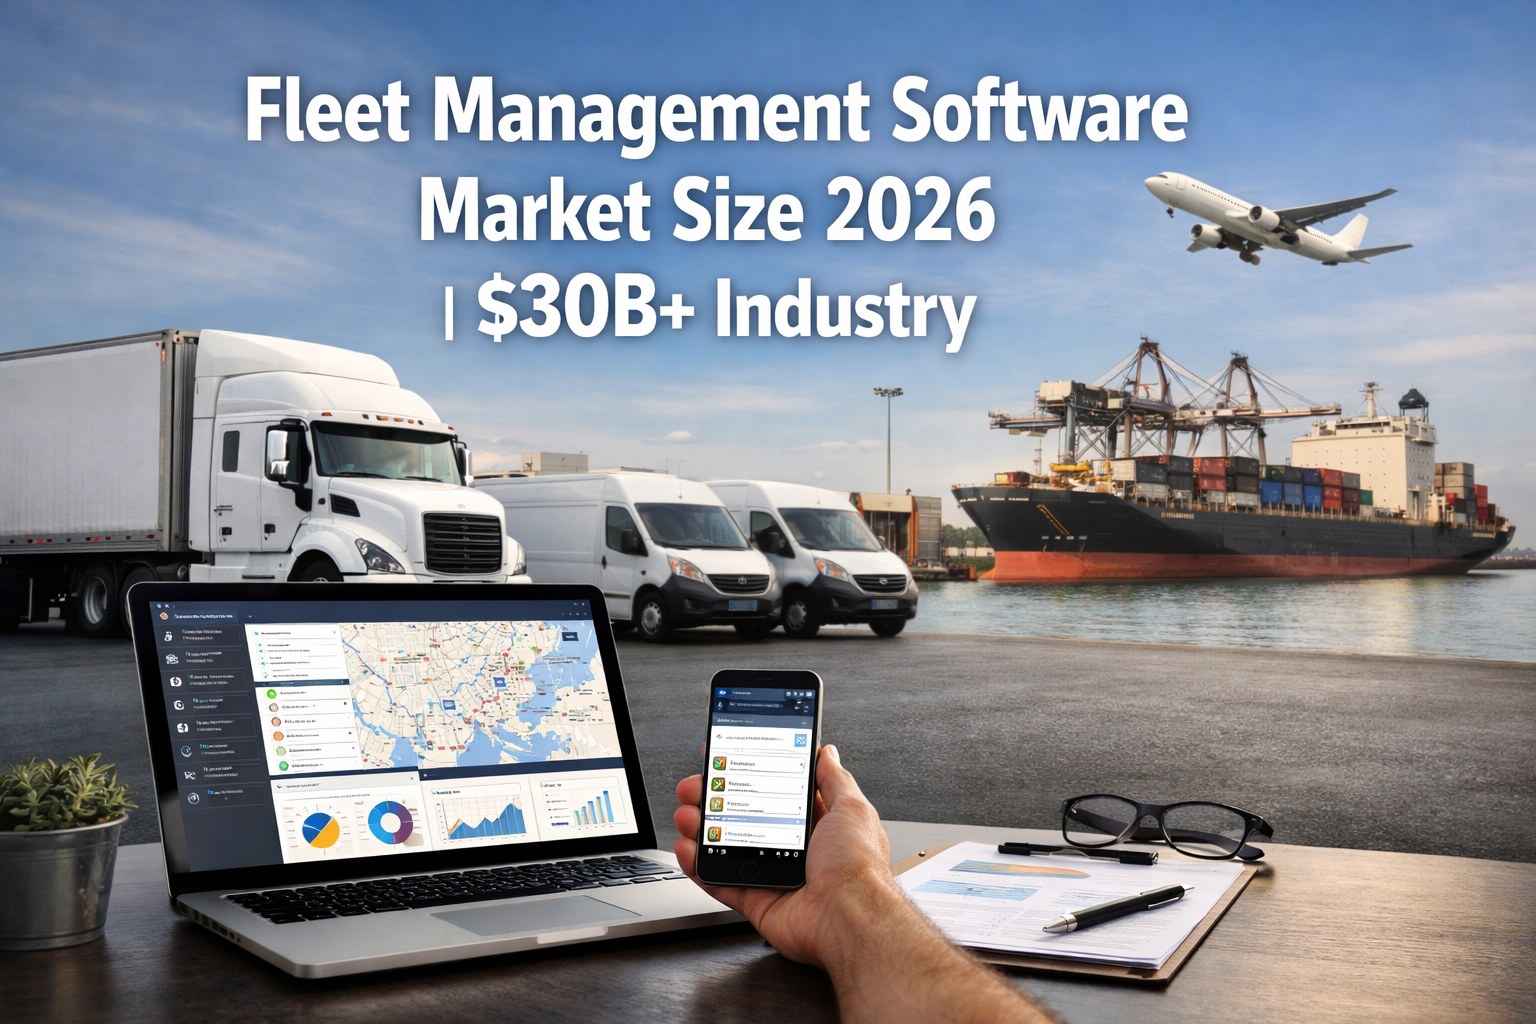
The global fleet management software market is projected to exceed $30 billion in 2026, driven by accelerating digital transformation across transportation, logistics and commercial vehicle operations. With a compound annual growth rate (CAGR) of 15-17% expected through 2030, fleet technology represents one of the fastest-growing segments in enterprise software. This comprehensive market analysis examines the key drivers, segments, regional dynamics, and investment opportunities shaping the fleet management industry in 2026 and beyond.
For fleet operators evaluating software solutions, understanding market trends provides critical context for technology decisions. Companies investing in fleet management software for US operations are positioned to capture significant competitive advantages as the industry evolves. This report offers actionable insights for fleet managers, logistics executives, investors, and technology buyers navigating the rapidly expanding fleet software market.
Market Size and Growth Trajectory
The fleet management software market has experienced remarkable expansion over the past decade, accelerating significantly since 2020. Industry analysts project the global market to reach $30.5 billion in 2026, up from approximately $19.5 billion in 2022. This represents a four-year growth of over 56%, reflecting the urgent demand for digital fleet solutions across all commercial vehicle sectors.
Fleet Management Software Market Size by Year
| Year | Market Size (USD) | YoY Growth | Key Market Driver |
|---|---|---|---|
| 2022 | $19.5 Billion | 14.2% | Post-pandemic fleet digitization |
| 2023 | $22.3 Billion | 14.4% | ELD mandate enforcement |
| 2024 | $25.6 Billion | 14.8% | AI analytics adoption |
| 2025 | $28.2 Billion | 15.6% | Predictive maintenance growth |
| 2026 | $30.5 Billion | 16.3% | Integrated fleet ecosystems |
| 2028 (Projected) | $38.7 Billion | 15.8% CAGR | Autonomous fleet management |
| 2030 (Projected) | $52.4 Billion | 16.2% CAGR | Full fleet digitization |
The acceleration in growth rate from 14.2% in 2022 to a projected 16.3% in 2026 reflects several converging factors: stricter regulatory compliance requirements, rising fuel costs driving optimization needs, and the maturation of AI-powered fleet analytics. By 2030, the market is expected to surpass $52 billion as autonomous vehicle management and full fleet digitization become standard across the industry.
Key Growth Drivers in the Fleet Management Industry
Several interconnected factors are fueling the fleet management software market expansion. Understanding these drivers helps fleet operators and investors identify where the greatest opportunities lie in 2026 and beyond.
Regulatory Compliance Requirements
DOT regulations, ELD mandates, FMCSA requirements, and emissions reporting are forcing fleets to adopt digital compliance solutions. Non-compliance penalties can exceed $16,000 per violation, making software investment a clear financial decision.
Fuel Cost Optimization
With diesel prices remaining volatile between $3.50-4.50 per gallon, fleets using optimization software report 8-15% fuel savings through route optimization, idle reduction, and driver behavior monitoring—savings that directly impact bottom-line profitability.
AI & Telematics Adoption
Advanced telematics and AI-powered analytics are becoming essential for competitive fleet operations. Machine learning algorithms now predict maintenance needs, optimize routes in real-time, and identify cost-reduction opportunities that reduce operating expenses by 20-30%.
Digital Fleet Transformation
Enterprise-wide digitization initiatives are driving fleet software adoption as companies seek unified operational visibility. Paper-based processes are being replaced by integrated digital systems that connect dispatch, maintenance, compliance, and financial reporting.
Safety & Risk Reduction
Insurance incentives and liability concerns are pushing fleets toward comprehensive safety monitoring. Companies using fleet safety software report 25-40% reduction in accidents, with corresponding decreases in insurance premiums and legal exposure.
Labor & Workforce Optimization
Driver shortages affecting 80,000+ positions and rising labor costs are accelerating adoption of software that maximizes workforce productivity. Fleet management platforms improve driver retention through better scheduling, communication, and working conditions.
See How Leading Fleets Are Capturing Market Advantages
Discover how FleetRabbit helps fleets reduce costs by 23% while improving compliance rates to 98.7%.
Market Segmentation Analysis
The fleet management software market is segmented across multiple dimensions, each with distinct growth characteristics and adoption patterns. Understanding these segments helps buyers identify solutions tailored to their specific needs and helps investors target high-growth opportunities.
Segmentation by Fleet Size
| Fleet Size | Market Share 2026 | Growth Rate | Key Characteristics |
|---|---|---|---|
| Small Fleets (1-50 vehicles) | 28% | 18.2% CAGR | Fastest adoption growth; cost-sensitive; cloud-first |
| Medium Fleets (51-500 vehicles) | 35% | 16.8% CAGR | Largest segment; compliance-driven; feature-focused |
| Large Fleets (501-2000 vehicles) | 24% | 14.5% CAGR | Enterprise requirements; custom integrations |
| Enterprise Fleets (2000+ vehicles) | 13% | 12.3% CAGR | Complex deployments; hybrid solutions; global operations |
Small and medium fleets represent the fastest-growing segments as cloud-based solutions make enterprise-grade capabilities accessible at affordable pricing tiers starting at $3 per vehicle per month. These segments are projected to account for 63% of new market growth through 2028.
Segmentation by Industry Vertical
Transportation & Logistics
Trucking companies, freight carriers, and 3PL providers represent the largest vertical. ELD mandates and shipper visibility requirements drive near-universal adoption.
Construction
Heavy equipment and support vehicle fleets. Asset utilization tracking and job site coordination are primary drivers.
Field Services
HVAC, plumbing, electrical, and maintenance companies. Route optimization and technician dispatch are key requirements.
Government & Public Sector
Municipal fleets, emergency services, and federal agencies. Compliance reporting and asset accountability drive adoption.
Delivery & Last-Mile
E-commerce growth has accelerated adoption. Real-time tracking and proof of delivery are essential features.
Other Verticals
Includes utilities, oil & gas, healthcare, and passenger transport sectors with specialized requirements.
Segmentation by Deployment Type
Cloud-based deployment has emerged as the dominant model, accounting for 72% of new fleet software implementations in 2025. This shift reflects several advantages:
Cloud-Based (SaaS)
- Lower upfront costs—subscription pricing
- Automatic updates and feature additions
- Mobile accessibility from anywhere
- Faster implementation (days vs months)
- Scalability without infrastructure investment
- Vendor-managed security and compliance
On-Premise
- Full data control and ownership
- Custom security requirements
- Legacy system integration needs
- Regulatory requirements in specific industries
- Large enterprise preference
- Declining share year-over-year
Segmentation by Vehicle Type
Regional Market Analysis
The fleet management software market shows distinct regional characteristics, with North America maintaining leadership while Asia-Pacific emerges as the fastest-growing region.
United States Market Dominance
The United States represents the largest single national market, accounting for approximately 32% of global fleet software revenue. Key factors driving US market leadership include:
US Market Growth Factors:
- Stringent DOT and FMCSA regulatory environment
- High labor costs driving automation investment
- Advanced telematics infrastructure
- Strong venture capital funding for fleet tech startups
- Large geographic distances requiring optimization
- Mature SaaS adoption across enterprises
Regional Market Comparison
| Region | 2026 Market Size | Global Share | CAGR 2024-2030 | Key Growth Driver |
|---|---|---|---|---|
| North America | $11.6 Billion | 38% | 14.8% | Regulatory compliance |
| Europe | $8.5 Billion | 28% | 15.2% | Emissions regulations |
| Asia-Pacific | $7.3 Billion | 24% | 19.4% | E-commerce logistics growth |
| Latin America | $1.8 Billion | 6% | 17.6% | Fleet security concerns |
| Middle East & Africa | $1.3 Billion | 4% | 16.8% | Oil & gas sector digitization |
Asia-Pacific shows the highest growth rate at 19.4% CAGR, driven by explosive e-commerce expansion in China and India, combined with government initiatives promoting logistics digitization. Europe's growth is powered by strict emissions regulations and the European Green Deal requirements for fleet sustainability reporting.
Operating a Fleet in the United States?
FleetRabbit is purpose-built for US fleets with DOT compliance, FMCSA requirements, and state-specific regulations built in.
Technology Trends Shaping Fleet Management in 2026
The fleet management software market is being transformed by several converging technology trends that are redefining what's possible for fleet operations. Companies that adopt these technologies are achieving significant competitive advantages.
AI-Powered Analytics
Machine learning algorithms analyze millions of data points to identify patterns invisible to human operators. AI now predicts maintenance failures 2-3 weeks in advance with 94% accuracy, optimizes routes considering 40+ variables in real-time, and identifies driver coaching opportunities that reduce accidents by 35%.
Predictive Maintenance
Moving beyond scheduled maintenance to condition-based servicing. IoT sensors monitor engine health, tire pressure, brake wear, and hundreds of other parameters to predict exactly when maintenance is needed—reducing unplanned downtime by 45% and maintenance costs by 25%.
IoT Sensor Networks
Connected sensors throughout vehicles and cargo create comprehensive operational visibility. Temperature monitoring for cold chain, door sensors for security, weight sensors for load optimization, and environmental monitors for compliance—all feeding into unified fleet dashboards.
Automation & Workflows
Automated workflows eliminate manual processes across fleet operations. From automatic compliance report generation to AI-dispatching that assigns the optimal driver-vehicle combination, automation reduces administrative burden by 60% while improving accuracy and speed.
Data-Driven Operations
Fleet decisions increasingly driven by data rather than intuition. Advanced analytics platforms aggregate data from telematics, fuel cards, maintenance records, and external sources to provide actionable intelligence that improves every aspect of fleet performance.
Real-Time Visibility
Instant access to fleet status from any device. Modern platforms provide sub-10-second GPS updates, real-time alerts for exceptions, and live dashboards that give fleet managers complete operational awareness regardless of fleet size or geographic spread.
Buyer Insights: Why Companies Are Switching to Fleet Software
Understanding why companies transition from manual processes or legacy systems to modern fleet management software reveals the compelling value proposition driving market growth. Research across thousands of fleet software buyers shows consistent patterns in purchasing decisions.
Manual Processes Can't Scale
As fleets grow, spreadsheet-based tracking and paper processes become unmanageable. A 25-vehicle fleet might function with manual methods, but expansion to 50+ vehicles typically creates operational chaos without software support. The breaking point often comes when compliance violations or missed maintenance events cause costly incidents.
Compliance Risk Is Too High
DOT audits, FMCSA safety ratings, and state inspections create significant liability for fleets without systematic compliance tracking. A single out-of-service violation can cost $16,000+ in fines plus lost revenue. Software that automates compliance documentation eliminates this risk.
Cost Visibility Is Essential
Without software, fleets often can't answer basic questions: What's my true cost per mile? Which vehicles are underperforming? Where is money being wasted? Modern fleet platforms provide instant answers that enable data-driven decisions.
Customer Expectations Have Changed
Shippers and customers now expect real-time visibility, accurate ETAs, and instant proof of delivery. Fleets without these capabilities lose business to competitors who can provide the transparency modern supply chains demand.
Legacy Systems Are Limiting Growth
Older on-premise systems often lack mobile capabilities, integration options, and modern features that today's operations require. Migration to cloud platforms unlocks new capabilities while reducing IT burden and total cost of ownership.
Business Impact & ROI Analysis
Fleet management software delivers measurable returns across multiple operational dimensions. Industry data shows consistent ROI patterns that make software investment a clear financial decision for most fleet operations.
Average ROI by Fleet Size (Annual Savings)
Savings Breakdown by Category
Beyond direct cost savings, fleet software delivers operational improvements that enhance competitive positioning: 23% increase in fleet utilization, 35% reduction in customer complaints, 40% faster invoice processing, and 98%+ compliance rates that protect safety ratings and business reputation.
Calculate Your Fleet's Potential ROI
See exactly how much FleetRabbit can save your fleet with transparent pricing starting at $3/vehicle/month.
Industry Expert Analysis
The fleet management software market in 2026 represents a inflection point where digital transformation shifts from competitive advantage to operational necessity. Several key observations emerge from market analysis:
Market Consolidation Accelerating
The fleet software market is seeing increased M&A activity as larger players acquire specialized solutions to build comprehensive platforms. This consolidation benefits buyers through more integrated offerings while potentially reducing vendor options in specific niches. Companies evaluating solutions should consider vendor stability and roadmap alongside current features.
AI Becoming Table Stakes
What was premium AI functionality two years ago is rapidly becoming baseline expectation. By 2027, fleet platforms without predictive analytics, intelligent automation, and machine learning capabilities will struggle to remain competitive. Buyers should evaluate not just current AI features but vendor investment in advanced analytics development.
Integration Ecosystem Critical
Standalone fleet software is giving way to integrated ecosystems connecting ELDs, fuel cards, accounting systems, HR platforms, and customer systems. The most successful implementations in 2026 treat fleet software as the operational hub connecting all transportation technology rather than an isolated tool.
Small Fleet Opportunity Expanding
Cloud platforms and per-vehicle pricing have democratized enterprise capabilities for small fleets. The 10-50 vehicle segment shows the highest adoption growth rate as operators recognize that software ROI scales down effectively. This segment represents the largest untapped market opportunity through 2030.
Frequently Asked Questions About Fleet Management Market
The global fleet management software market is projected to reach $30.5 billion in 2026, growing from $19.5 billion in 2022. This represents a compound annual growth rate (CAGR) of approximately 15-17%. North America accounts for the largest regional share at 38%, with the United States alone representing a $9.8 billion market.
The fleet management software market is expected to grow at a 15-17% CAGR through 2030, reaching approximately $52.4 billion. Growth acceleration is driven by AI adoption, regulatory requirements, and expanding use cases in electric vehicle management and autonomous fleet operations.
Transportation and logistics leads with 32% market share, followed by construction (18%), field services (15%), government and public sector (12%), and delivery/last-mile (10%). Other verticals including utilities, healthcare, and oil & gas account for the remaining 13%. Adoption is increasing across all sectors as software becomes more accessible and affordable.
Six primary factors drive growth: regulatory compliance requirements (DOT, FMCSA, ELD mandates), fuel cost optimization needs, AI and telematics technology adoption, enterprise digital transformation initiatives, safety and risk reduction priorities, and labor optimization amid driver shortages. These factors create compelling ROI that accelerates adoption across fleet sizes.
Cloud-based (SaaS) deployment dominates with 72% of new implementations in 2025, up from 58% in 2020. Cloud advantages include lower upfront costs, automatic updates, mobile accessibility, faster deployment, and reduced IT burden. On-premise solutions retain 28% share primarily among large enterprises with specific data control or integration requirements.
Fleet management software pricing varies significantly by vendor and features. Traditional enterprise platforms like Samsara charge $25-45 per vehicle monthly with long-term contracts. Newer cloud platforms like FleetRabbit offer pricing starting at $3 per vehicle monthly with no contracts. Annual costs range from $36 to $540 per vehicle depending on the solution and features required.
Industry data shows average annual savings of $3,120 per vehicle from fleet management software—combining fuel optimization (38%), maintenance reduction (31%), administrative efficiency (18%), and insurance/compliance savings (13%). With modern pricing around $36-60 per vehicle annually, this represents ROI of 50-87x, with payback periods often under 30 days.
Key technology trends include AI-powered predictive analytics, IoT sensor networks for real-time monitoring, automated workflow systems, integrated platform ecosystems, electric vehicle management capabilities, and advanced driver safety systems. By 2026, AI analytics and predictive maintenance will transition from premium features to baseline expectations across the market.
Ready to Modernize Your Fleet Operations?
See why 2,500+ fleets choose FleetRabbit for affordable, powerful fleet management. Start free with 3 vehicles—no credit card required.







