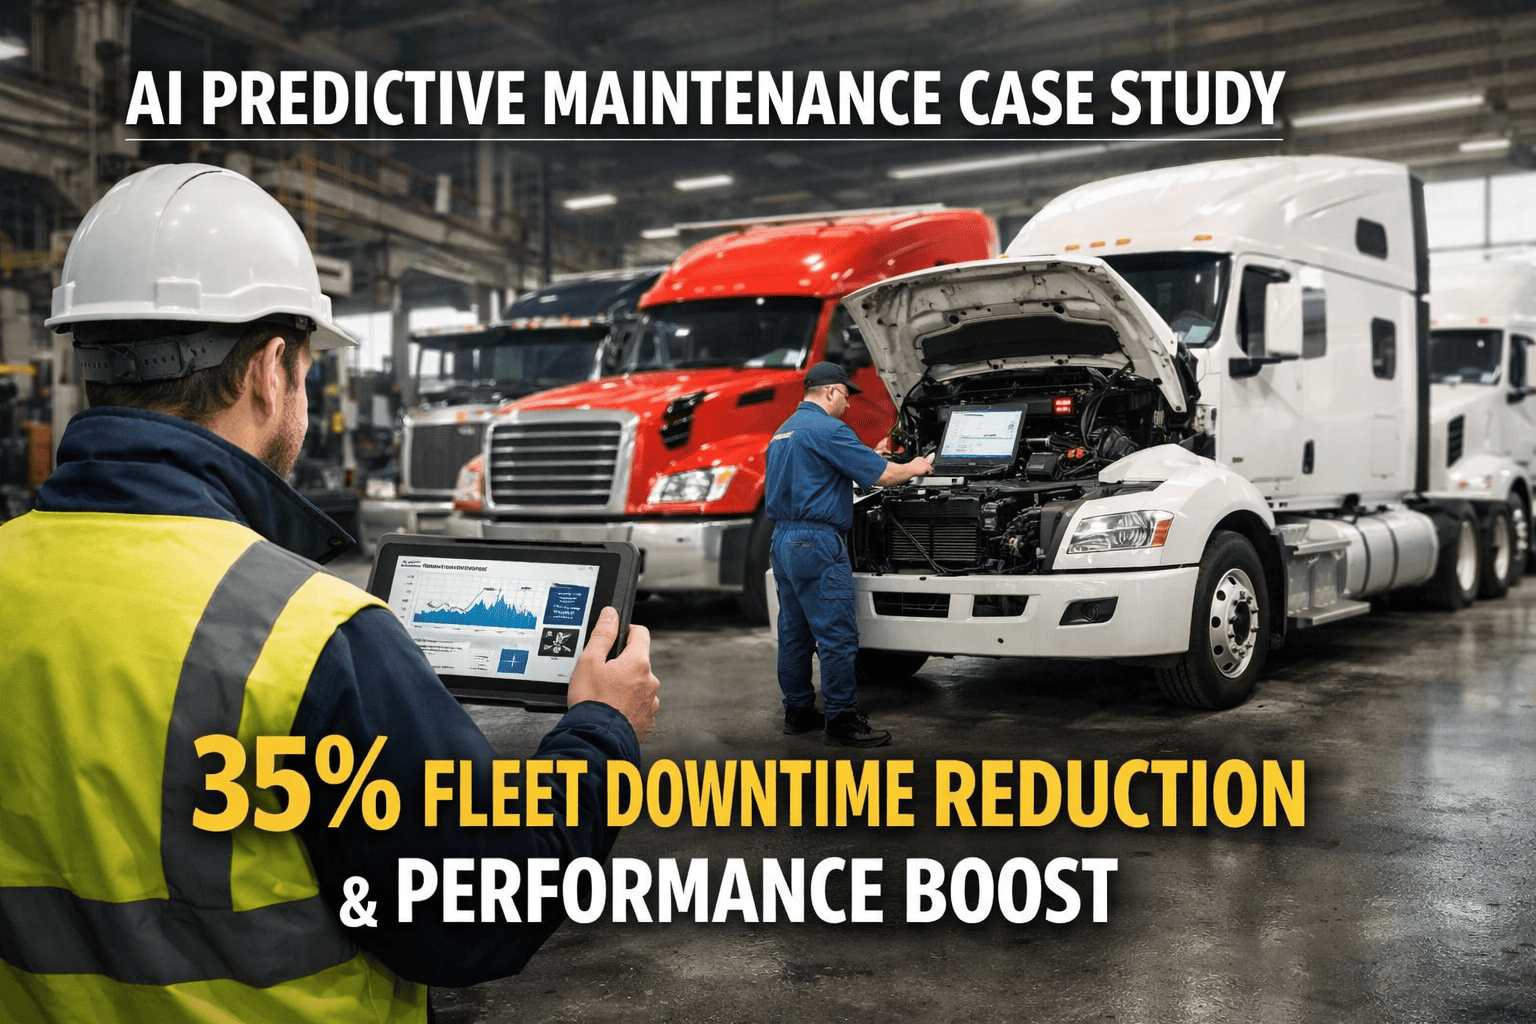
A logistics company running 85 vehicles was stuck in reactive mode: fixing trucks after they broke down, paying emergency repair rates, and losing $4,800 per breakdown incident. Despite following manufacturer-recommended service intervals religiously, breakdowns kept happening—23% of emergency repairs occurred within 2,000 miles of scheduled service. After implementing AI-powered predictive maintenance, they cut unexpected breakdowns by 35%, achieved 89% failure prediction accuracy, and documented $312,000 in year-one savings. This is their complete transformation story—with the technical details, implementation steps, and ROI breakdown you need to evaluate predictive maintenance for your fleet. Book a demo to see how this technology works with your telematics data.
AI Predictive Maintenance: 35% Downtime Reduction
How a regional logistics company transformed reactive maintenance into predictive precision, and documented measurable ROI within 90 days.
The Company Profile
The company operates a mixed fleet of 85 vehicles—including Class 6-8 trucks and delivery vans—serving a 6-state region with demanding delivery schedules. Their operational reality: 92% fleet utilization, 72,000 miles per vehicle annually, and zero tolerance for late deliveries in their customer contracts.
Their fleet maintenance team consisted of 4 in-house technicians and relationships with 12 regional service providers. They used a major telematics platform for GPS tracking and basic engine diagnostics, but maintenance decisions were driven by manufacturer-recommended intervals—not actual vehicle condition data.
The Problem: Why Preventive Maintenance Wasn't Enough
Before implementing AI predictive maintenance, the company ran what they considered a "best-in-class" preventive maintenance program. Oil changes every 10,000 miles. Tire rotations on schedule. Brake inspections at fixed intervals. Every service was documented, every interval followed.
The problem: fixed maintenance schedules are blind to actual component condition. A turbocharged diesel running 80,000 hard highway miles per year degrades differently than the same model doing 30,000 urban delivery miles. Fixed schedules treated them identically—and breakdowns kept happening.
Before: The Hidden Costs of Reactive Maintenance
Breakdowns per Month
Average roadside failures requiring emergency towing and repair
Cost per Incident
Towing + emergency repair premium + missed deliveries + customer penalties
Hours Downtime/Month
Vehicles waiting for diagnosis, parts, or emergency service slots
Annual Breakdown Costs
Direct repair costs plus indirect costs from delays and penalties
The Real Cost Breakdown
Emergency repairs cost 4-5x more than planned maintenance. When a truck breaks down on Interstate 40, the company paid:
The operations manager put it bluntly: "We were doing PM by the book, but 23% of our emergency repairs happened on vehicles that had been serviced within the last 2,000 miles. The service was done on time. The failure was invisible. We needed to see what was actually happening inside the engine—not just follow a calendar."
Sound Familiar?
If your fleet is still running time-based maintenance while breakdowns eat into your profits, you're not alone. See how AI predictive maintenance closes the visibility gap.
Understanding AI Predictive Maintenance Technology
Before diving into the implementation, it's important to understand what AI predictive maintenance actually does—and how it differs from the preventive maintenance programs most fleets already run.
How Machine Learning Predicts Failures
Traditional preventive maintenance follows fixed intervals based on manufacturer recommendations. Change oil every 10,000 miles. Inspect brakes every 30,000 miles. These intervals are designed for average conditions—but no vehicle operates in average conditions.
AI predictive maintenance uses machine learning algorithms to analyze real-time sensor data and identify the specific patterns that precede component failures. The system learns what "normal" looks like for each vehicle in your fleet, then detects subtle deviations that indicate developing problems—often 2-4 weeks before failure occurs.
What the AI Analyzes
Engine Telemetry
Temperature trends, oil pressure patterns, coolant consumption rates, fuel efficiency drift
Vibration Signatures
Abnormal patterns in rotating components: bearings, transmissions, driveline, exhaust systems
Fault Code Patterns
Not just individual codes, but combinations and sequences that correlate with specific failure types
Usage Context
Load cycles, idle time, driving conditions, route characteristics that accelerate or reduce wear
The key insight: a typical commercial vehicle generates thousands of fault codes per year. Without AI, maintenance teams either chase every alert (wasting time on noise) or ignore most codes (missing real problems). Machine learning identifies which combinations of data actually predict failures—reducing thousands of codes to 5-10 actionable issues per vehicle annually.
The Implementation: 4-Week Deployment
The company implemented FleetRabbit's AI predictive maintenance system over four weeks. Here's exactly what happened at each stage:
Data Integration
Connected existing telematics platform via API. No new hardware required—the company's GPS/ELD system was already capturing engine data (J1939 CAN bus), but that data wasn't being analyzed for predictive patterns. Integration completed in 2 days; data flowing within 48 hours.
Baseline Establishment
AI models began learning "normal" operating patterns for each vehicle. The system analyzed 14 days of historical data to establish baselines for engine temperature, vibration signatures, and performance metrics. Vehicles with existing issues were flagged immediately.
Alert Configuration
Configured alert thresholds and routing. Critical predictions (brake, steering, engine) routed to maintenance supervisor immediately. Lower-priority items queued for next scheduled service. Integrated with existing work order system for automatic work order generation.
Technician Training
4-hour training session for maintenance team on interpreting predictions, troubleshooting recommended actions, and providing feedback to improve model accuracy. Technicians learned to trust the system after seeing prediction accuracy in week 2-3.
The Results: Documented Performance Improvements
The company tracked results rigorously from day one. Here's what the data showed at 90 days, 6 months, and 12 months post-implementation:
90-Day Results
Prediction Accuracy Over Time
The AI system's accuracy improved as it learned the fleet's specific patterns:
By day 90, the system achieved 89% accuracy on major component failure predictions with 2-4 weeks advance warning. False positive rate dropped to under 8%—meaning technicians trusted the alerts because they almost always led to real issues.
See Your Fleet's Predictive Potential
Your telematics data contains failure patterns waiting to be discovered. In a 20-minute demo, we'll show you exactly how AI analysis works with your existing systems.
Real Failure Prevention Examples
The most compelling evidence came from specific failures the AI caught that traditional PM would have missed. Here are three documented examples from the first year:
Transmission Failure Prevented
Vehicle #47 - Freightliner M2 106AI detected abnormal transmission fluid temperature patterns—slight but consistent elevation over 12 days, combined with unusual vibration signatures during gear shifts. The pattern matched historical failure data for transmission bearing wear.
Brake System Alert
Vehicle #23 - International LT625Vibration analysis flagged caliper issue 12 days before scheduled brake inspection. The AI identified asymmetric braking force patterns that indicated a sticking caliper—invisible during visual inspection but detectable through sensor data patterns.
Cooling System Prediction
Vehicle #61 - Kenworth T680Algorithm identified subtle coolant flow anomaly—engine reaching operating temperature 8% faster than baseline, with slightly elevated post-shutdown temperatures. Pattern indicated water pump bearing degradation 21 days before catastrophic failure.
The Complete ROI Analysis
At 12 months post-implementation, the company documented comprehensive ROI across all cost categories. The analysis compared actual costs to the 12-month period before implementation:
12-Month Financial Impact
Direct Cost Savings
Indirect Cost Savings
Payback Period Analysis
The company achieved payback in the first quarter. A single prevented transmission failure in week 3 ($6,100 saved) covered nearly the first quarter's platform cost. By month 3, cumulative savings exceeded $78,000 against $18,500 in platform costs.
Integration with Existing Systems
A critical success factor was seamless integration with the company's existing technology stack. No rip-and-replace—the AI layer connected to systems already in place:
Telematics Platform
API connection to existing GPS/ELD system. Data pulled automatically every 5 minutes. No changes required to telematics configuration or driver devices.
Work Order System
Predictions automatically generate work orders with failure type, recommended action, and parts list. Technicians receive assignments through existing workflow.
DVIR System
Driver-reported issues combined with sensor data improved prediction accuracy by 15%. When a driver reports "unusual noise," AI correlates with sensor patterns for faster diagnosis.
Parts Inventory
Predictions feed into parts planning. System identifies which parts will be needed 2-4 weeks out, enabling planned procurement vs. emergency orders at premium pricing.
Key Success Factors
The implementation team identified four factors that drove successful adoption:
Early Win Built Credibility
The week 3 transmission prediction that saved $6,100 instantly validated the investment. Technicians and management saw concrete proof before skepticism could take root. Lesson: prioritize quick wins in the first 30 days.
Technician Trust Through Accuracy
Mechanics initially resisted "computer telling them what to fix." That changed when predictions consistently revealed real issues. By month 2, technicians were requesting AI analysis on vehicles they suspected had problems.
Integration, Not Replacement
The system enhanced existing workflows rather than requiring new processes. Work orders appeared in the same system techs already used. Alerts routed through familiar channels. Adoption happened naturally.
Feedback Loop Improved Accuracy
When technicians confirmed or corrected predictions, that feedback trained the model. The system learned this fleet's specific patterns—not just generic failure modes. Accuracy improved from 72% to 91% over 6 months.
Industry Benchmarks: How This Compares
The company's results align with documented outcomes across the fleet and logistics industry:
Industry research from 2025 shows 65% of maintenance teams plan to implement AI-powered predictive maintenance by end of 2026—but only 27% currently use it. The gap between planning and operational deployment represents competitive advantage for early adopters.
Frequently Asked Questions
Most fleets are fully operational within 2-4 weeks. Integration with existing telematics takes 1-2 days. The AI system starts learning your fleet patterns immediately and begins generating predictions within the first week. Prediction accuracy improves over the first 60-90 days as the model calibrates to your specific vehicles and operating conditions. The company in this case study saw actionable predictions by day 14.
No. FleetRabbit's AI connects to your existing telematics, ELD, or GPS system. If your vehicles already transmit engine data via J1939 CAN bus or OBD-II (which most commercial telematics systems do), we can analyze that data immediately. Optional supplementary sensors for vibration analysis can improve predictions for specific failure types, but are not required to start.
Fleets of 25-500 vehicles typically see the highest percentage ROI because they have enough vehicles to benefit from pattern recognition while each prevented failure has significant impact. A single prevented major breakdown (transmission, engine, etc.) can cover 6-12 months of platform costs. Larger fleets see higher absolute savings. FleetRabbit is free for up to 3 vehicles, making it accessible for evaluation.
Initial accuracy ranges from 70-75% in the first 30 days, improving to 85-92% by day 90 as the model learns your fleet's specific patterns. The system is designed to minimize false positives—technicians trust alerts because 90%+ lead to real issues. False positive rates typically drop below 8% within 90 days. Accuracy continues improving as the feedback loop refines predictions.
The system predicts failures across all major systems: engine (bearings, pumps, injectors), transmission (fluid degradation, bearing wear), brakes (caliper, pad wear patterns), cooling system (water pump, thermostat), electrical (alternator, battery), fuel systems, and drivetrain components. Prediction capability depends on available sensor data—fleets with richer telematics see more comprehensive coverage.
Predictive maintenance complements—not replaces—your PM program. The AI identifies issues between scheduled services and recommends bundling repairs during PM windows when possible. Many fleets find they can extend PM intervals on healthy vehicles while catching problems earlier on stressed vehicles. The result: more efficient use of PM resources and fewer surprises between services.
Ready to See Your Fleet's Predictive Potential?
Book a personalized demo and we'll analyze your current maintenance patterns, identify predictable failure risks, and project your specific ROI based on fleet size, vehicle types, and current breakdown rates.