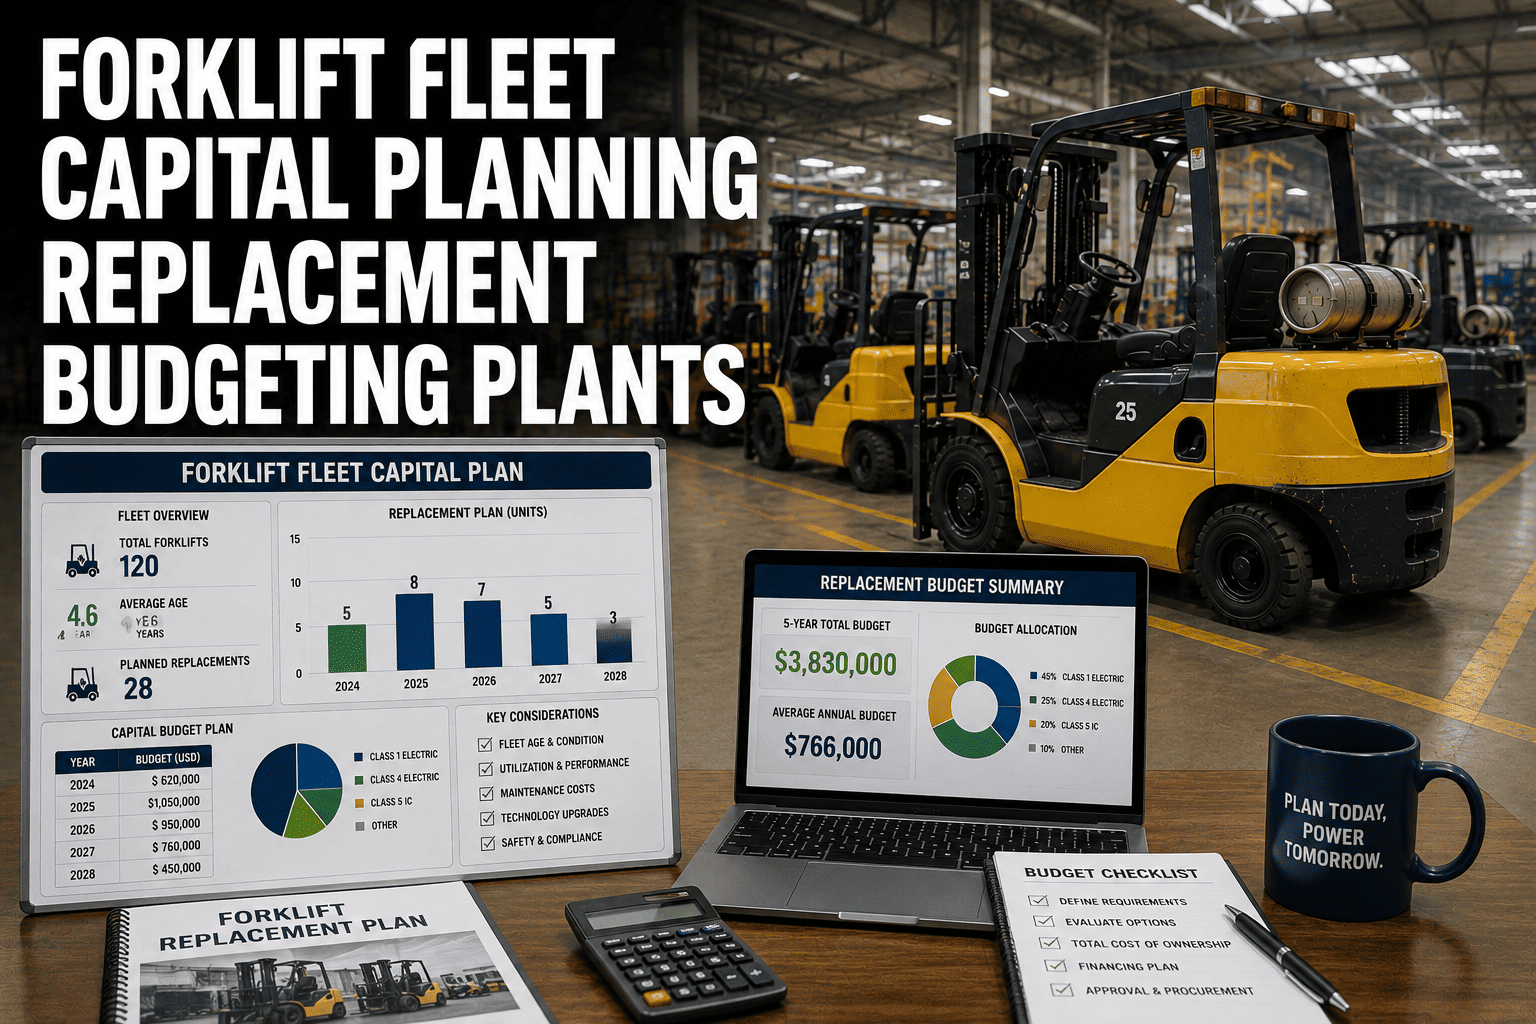
Ask most plant managers why a specific forklift is due for replacement this year and the answer is usually a feeling, not a number. It looks tired, it breaks down more than it used to, or it simply hit a round number of years in service. Finance teams hate approving budgets built on feelings, and they are right to. A forklift replacement decision built on real cost-per-hour data, not gut instinct, is the difference between a capital plan finance signs off on immediately and one that gets pushed back for another quarter of guessing.
Forklift capital planning means tracking each truck's ownership cost and maintenance cost per hour so replacement, rebuild, or retain decisions are based on data rather than age alone. Once annual maintenance cost climbs to 15 to 20 percent of a forklift's current fair market value, continued ownership is difficult to justify economically. Maintenance costs on trucks older than seven years commonly run double that of newer units, and most fleets need a 10 to 14 percent budget contingency to absorb the swing.
Years 1-2
Low, predictable maintenance under warranty
Years 3-4
Costs begin rising as warranty coverage ends
Years 5-6
Steep climb, major components start failing
Year 7+
Battery, parts scarcity, replace zone
Why Forklift Replacement Decisions Default to Guesswork
Most procurement decisions start and end with the sticker price. A plant negotiates the best deal on a new truck, takes delivery, and moves on to the next problem, never circling back to measure what that truck actually costs to run over its life. The purchase price is a fraction of the total investment. Maintenance, fuel or battery charging, parts sourcing, and the downtime a truck causes while sitting in the shop all compound quietly in the background, and without a system tracking them per unit, nobody notices until a truck is bleeding the budget dry.
The Knowledge Gap Costs More Than the Truck
Organizations that lack accurate cost data on their own fleet tend to hold equipment too long, service it reactively after something breaks, and replace units on arbitrary age-based timelines instead of financial ones. That knowledge gap is itself a cost. A truck kept two years past its economical replacement point can quietly cost more in accumulated repairs and downtime than simply financing its replacement would have.
Why Age Alone Is a Poor Signal
Two forklifts of the same model year can have completely different cost profiles depending on hours run, application intensity, and how consistently preventive maintenance was followed. Replacing strictly by age either retires trucks with life left in them or holds onto trucks that are already costing more than a new one would.
FleetRabbit tracks maintenance spend, downtime, and run hours per forklift so your capital plan is built on numbers finance can trust. Sign up for a free trial and pull your own fleet's cost curve this week.
The Real Cost Curve of Forklift Ownership
Every forklift, regardless of powertrain, follows a predictable cost trajectory. Costs stay low and manageable in the early years, then climb steadily as components wear and warranty coverage expires. Calculating your own cost-per-hour figure is straightforward once maintenance and ownership records are in one place.
| Cost Component | How to Calculate | Example |
|---|---|---|
| Ownership Cost | Delivered cost minus current trade-in value, divided by total hours run | 15000 minus 6000, over 8500 hours, equals 1.06 dollars per hour |
| Maintenance Cost | Cumulative parts and labor spend since purchase, divided by total hours run | 8800 dollars over 8500 hours equals 1.04 dollars per hour |
| Total Cost Per Hour | Ownership cost per hour plus maintenance cost per hour | 1.06 plus 1.04 equals 2.10 dollars per hour to operate |
| Replace Threshold | Annual maintenance spend as a percentage of current fair market value | 15 to 20 percent of FMV signals a replacement review |
Where Battery Replacement Fits the Curve
For electric fleets, battery replacement is typically the single largest capital event in a forklift's life, usually landing around year seven. Plants that do not plan for it treat it as a surprise expense, when in reality it is one of the most predictable line items in the entire capital plan.
Building Your Replace, Rebuild, or Retain Decision Matrix
Not every aging truck needs a full replacement. Segmenting the fleet into three clear buckets lets a plant prioritize capital spend instead of trying to replace everything at once.
Retain
Cost per hour is stable, maintenance is under 15 percent of FMV, and the truck still fits current operational needs.
Rebuild
Major component failure on an otherwise sound frame, where a targeted rebuild costs less than a full replacement.
Replace
Maintenance cost has crossed the 15 to 20 percent of FMV threshold, or parts are increasingly hard to source.
Building a Five-Year Capital Plan
A capital plan finance actually approves comes from real cost data laid out over multiple years, not a single-year wish list submitted every budget cycle.
Step One: Pull Cost-Per-Hour Data on Every Truck
Gather ownership and maintenance cost per hour for the full fleet, sorted from lowest to highest, to see exactly which units are already in or approaching the replace zone.
Step Two: Segment Into Retain, Rebuild, and Replace
Apply the decision matrix above to every truck, then group replacements into logical phases rather than a single large purchase that strains one year's budget.
Step Three: Model Lease Versus Buy for Each Phase
Leasing enforces a disciplined replacement cycle and keeps annual costs predictable, while buying can suit lower-utilization trucks where ownership cost per hour stays low longer. Compare both structures against your actual usage data before committing.
Step Four: Build in a Budget Contingency
Most fleets carry a 10 to 14 percent contingency in their capital plan to absorb pricing swings, giving the plan room to flex without derailing the whole schedule.
FleetRabbit's cost and reliability data segments your fleet automatically, so budget season starts with a plan instead of a spreadsheet built from memory. Book a demo and see your fleet's capital plan mapped out.
A forklift replacement decision is only as good as the data behind it. Plants that track cost per hour, maintenance trend, and downtime by individual truck stop treating replacement as a once-a-year guessing exercise and start building a capital plan finance can approve with confidence. The trucks quietly bleeding the budget dry get identified early, the ones with life left in them stay in service longer, and every dollar of capital spend goes exactly where the data says it is needed.
FleetRabbit turns real cost and reliability data into a clear replace, rebuild, or retain plan for every truck in your fleet. Start free and see your fleet's cost curve within days, no credit card required.