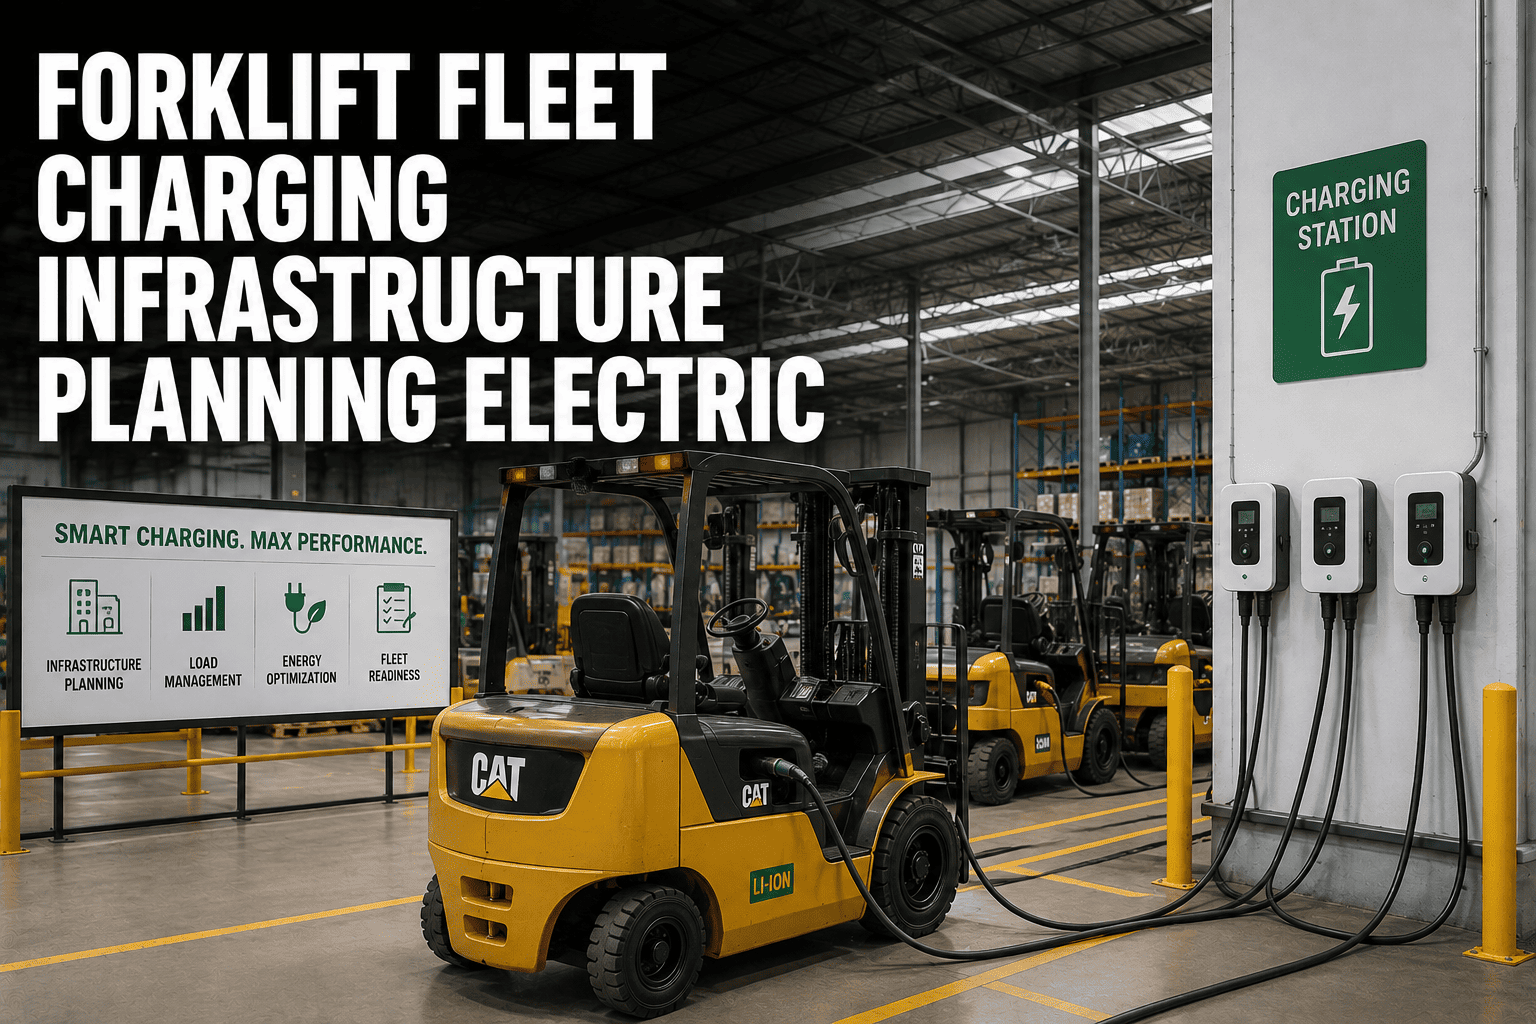
Ask an electrician to size a forklift charging installation and the first question back is never about the forklifts. It's about kilowatts, amps, and how many units will actually draw power at the exact same moment. That's the part most electrification plans skip. Teams pick chargers based on a spec sheet, install them, and then discover the building's 200-amp service was never built to carry twenty 30kW chargers running at once. Planning charging infrastructure properly means treating it as an electrical engineering project first and a forklift project second, built on real duty-cycle numbers instead of a catalog default. Before you commit to hardware, it's worth mapping your actual load against your electrical capacity, and the FleetRabbit team can walk through that math with you if you book a demo.
Planning charging infrastructure for an electric forklift fleet comes down to four steps: audit real duty-cycle hours per truck, calculate total power demand using connected load and a documented demand factor, size chargers to the kWh actually needed within your available charge window, and schedule charging to avoid peak demand-charge windows. A distribution center running twenty forklifts at roughly 30 kWh a day typically needs about 75 kW of peak capacity, which already exceeds many older facilities' 200-amp service, making the load calculation the single most important step before any equipment is purchased.
The Four-Phase Charging Infrastructure Roadmap
Skipping straight to charger selection is how facilities end up with the wrong equipment and an underbuilt panel. A structured roadmap keeps the electrical reality in front of the equipment decision, not behind it.
| Phase | What Happens | Output |
|---|---|---|
| 1. Duty-Cycle Audit | Log two weeks of real runtime, lift counts, and state-of-charge drops per truck | Actual kWh consumption per shift, not a manufacturer estimate |
| 2. Load Calculation | Sum connected charger load, apply a documented demand factor, convert to amperage | Required service size and whether existing panels can carry it |
| 3. Charger And Layout Design | Match charger power output to available charge window and truck location | Charger count, kW rating, and placement map |
| 4. Install And Schedule | Install to code, then stagger charge start times to avoid peak demand windows | Lower demand charges and stable panel loading |
Calculating Real Power Demand
The math behind charging infrastructure isn't complicated, but skipping it is the single most common cause of expensive retrofits. A simple example shows why the calculation has to happen before equipment gets ordered.
A Worked Example
A distribution center running 20 forklifts, each averaging 30 kWh of energy use per day, needs roughly 600 kWh of total daily charging capacity. If that charging happens inside an 8-hour overnight window, peak demand comes out to about 75 kW. At 480V three-phase, that translates to roughly 90 amps per phase, which is already more than many older facilities' 200-amp main service was ever designed to carry.
Why The Demand Factor Matters
Electrical code allows a demand factor below 100 percent only when documentation shows the chargers won't all draw their full nameplate load at the same time. Applying an incorrect demand factor in either direction is costly: too optimistic and the service entrance gets undersized, too conservative and the facility pays for capacity it will never use.
FleetRabbit logs actual runtime, lift counts, and state-of-charge trends per forklift, giving you the duty-cycle numbers an accurate load calculation depends on.
Sizing Chargers To Your Duty Cycle, Not A Catalog Default
Vendors often default to the largest charger in the lineup because it looks safe on paper. In practice, oversized fast chargers add unnecessary capex and drive up peak demand charges without improving anything, if the truck already has hours of idle time to work with.
| Available Charge Window | Typical Energy Need | Right-Sized Charger |
|---|---|---|
| 10 to 12 Hours (Overnight) | 30 to 45 kWh per truck | 10 to 15 kW, low stress on the battery |
| 6 to 8 Hours (Single Shift) | 35 to 45 kWh per truck | 15 to 25 kW DC |
| 3 to 4 Hours (Multi-Shift Break) | 35 to 45 kWh per truck | 25 to 30 kW DC |
| Under 2 Hours (Fast Turnaround) | 35 to 45 kWh per truck | 40 to 60 kW, higher demand charge impact |
The cost difference is real
A distributor running twelve counterbalance trucks on a single shift initially quoted 60 kW chargers across the board. After reviewing actual duty-cycle data showing under five hours of daily runtime per truck, the specification dropped to 25 kW units with smart scheduling, cutting capital cost by roughly 40 percent and eliminating peak demand charges entirely.
Voltage compatibility can't be skipped
A 48V charger cannot safely service a 36V or 80V battery pack. Mismatched voltage between charger and battery leads to incomplete charges, battery management system faults, and can cut battery lifespan by half, so voltage alignment has to be checked before any unit is purchased, not after.
Scheduling Around Demand Charges
Most facilities pay for electricity two ways: the energy actually consumed, and a separate demand charge based on the single highest peak of power draw in the billing period. Charging infrastructure is one of the few areas where scheduling alone, with no new hardware, can meaningfully cut that second number.
Staggering Start Times
Starting every truck's charger the moment a shift ends creates a single sharp demand spike. Staggering start times across a fifteen to thirty minute window spreads the same total energy draw over a longer period, lowering the peak the utility bill is based on.
Charging Off-Peak
Scheduling the bulk of charging between roughly 11pm and 5am, when utility tariffs are lowest, can cut energy costs by 30 to 50 percent compared to daytime charging, on top of whatever savings come from avoiding demand-charge spikes. Getting visibility into when your fleet is actually idle and ready to shift into that window starts with real usage tracking — you can sign up for a free trial to see your own fleet's pattern.
FleetRabbit shows exactly when each forklift goes idle, so charging can be staggered and shifted off-peak instead of hitting the panel all at once at shift change.
Frequently Asked Questions
Don't let a catalog default decide your panel upgrade or your demand charges. FleetRabbit gives you the actual duty-cycle data behind every forklift in your fleet, so your electrical plan is built on facts before a single charger is ordered.







