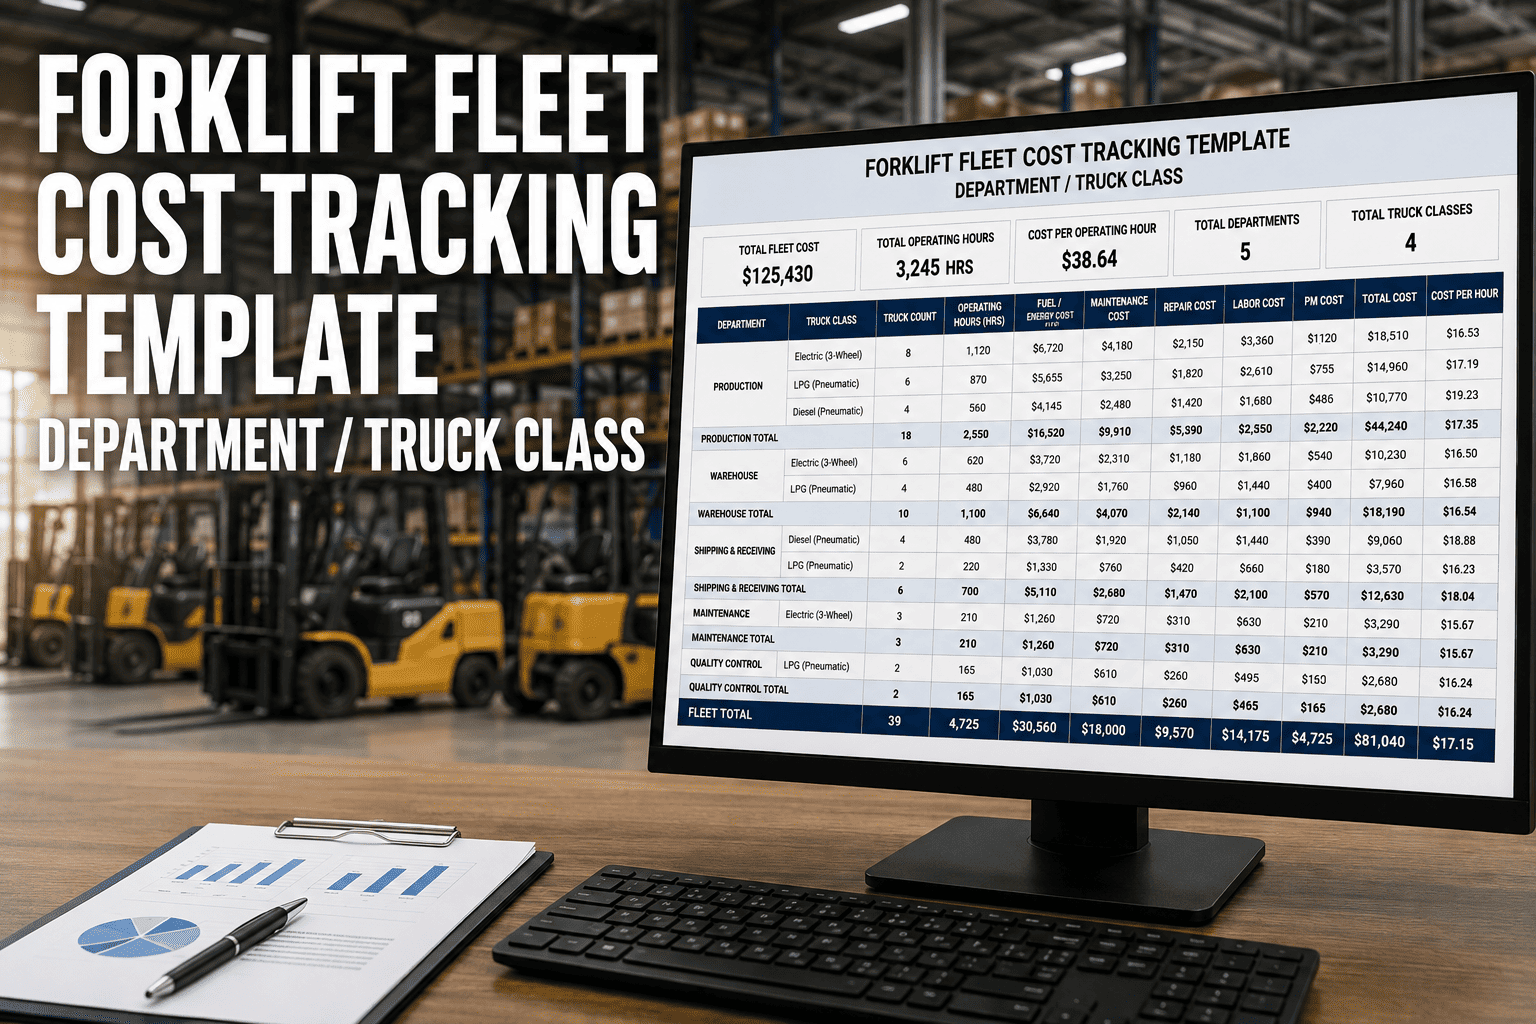
Manufacturing plants allocate forklift costs to the wrong department every day. Shipping loads a truck and charges the hours to logistics. Production borrows that same truck for an emergency line change and the hours disappear into an operational overhead pool nobody tracks. Warehouse uses three different truck classes but reports one blended cost per hour that makes it impossible to know which truck types are actually driving the department's material handling expenses. When the finance team asks warehouse to justify their forklift budget, the answer is a shrug because the data does not exist in the granularity needed to provide one. A cost tracking template organized by department and truck class eliminates this ambiguity by creating a structured framework where every forklift hour, every maintenance dollar, and every fuel or energy dollar is attributed to a specific department and a specific truck class simultaneously. This dual-dimension tracking reveals cost patterns that single-dimension tracking completely hides.
Plants without department-and-class cost tracking typically underestimate true forklift costs by 15 to 25 percent because shared usage, unattributed hours, and blended rate calculations obscure where money actually goes. Facilities implementing structured cost tracking by both dimensions identify 30000 to 80000 dollars annually in misallocated costs that can be corrected through better operational decisions.
The Two Dimensions That Matter: Department and Truck Class
Cost tracking that only organizes by department misses the truck class dimension that drives significant cost variation. Warehouse operates counterbalance trucks at 18 dollars per hour and reach trucks at 24 dollars per hour. If you track warehouse forklift costs as a single blended rate, the average might show 20 dollars per hour, which masks the fact that reach truck operations are 33 percent more expensive than counterbalance operations in the same department. This matters because it tells you where to focus cost reduction efforts. If warehouse reach truck costs are 33 percent higher than counterbalance, investigating why reach trucks cost more, whether some reach truck work could shift to counterbalance, and whether reach truck maintenance is driving the premium all become actionable questions that a blended rate completely obscures.
Conversely, cost tracking that only organizes by truck class misses the department dimension that reveals utilization and allocation problems. Counterbalance trucks cost 18 dollars per hour in warehouse but 12 dollars per hour in production. The truck class cost is identical but the department cost is 50 percent different. Without department-level tracking, you cannot see this discrepancy or investigate whether production's lower cost reflects genuine efficiency or simply fewer hours being attributed to production when the truck was actually working in another area. Both dimensions are necessary. Neither alone is sufficient. The template must capture both simultaneously for the data to reveal actionable insights.
Defining Your Truck Classes
Why Your Classes Must Match Your Actual Fleet
The four-class framework above is a starting point that must be customized to match the specific truck types in your facility. If you operate 10000-pound capacity counterbalance trucks, they do not fit neatly into Class B. Create a Class B-Heavy or Class D-Heavy subclass that captures the higher operating cost of larger equipment. If you operate electric pallet jacks as a separate tracked category, create a class for them. The goal is for every forklift in your fleet to map to exactly one truck class, and for that class to have a cost profile that accurately reflects the actual costs that class generates. When the class definitions match your fleet, the cost data that flows into the tracking template is meaningful and comparable. When the class definitions are too broad, you lose the granularity that makes truck-class tracking valuable. You can sign up for FleetRabbit to get a pre-configured cost tracking template with truck classes already matched to common manufacturing fleet compositions.
The Five Cost Categories That Fill Each Cell
Every cell in the department-by-class cost matrix must contain the same five cost categories to enable fair comparison across cells. The five categories are labor, fuel or energy, maintenance and parts, consumables and attachments, and overhead allocation. Each category requires a consistent calculation methodology so that differences between cells reflect actual operational differences rather than calculation inconsistencies.
FleetRabbit pulls labor rates, fuel or energy consumption, maintenance costs, and operating hours directly from your integrated data sources. It calculates fully-loaded cost per hour for every department-truck class combination and updates the matrix monthly. No spreadsheet maintenance, no manual data entry, no calculation errors.
Solving the Shared-Forklift Cost Allocation Problem
Shared forklifts are the biggest challenge in department-level cost tracking. When a counterbalance truck assigned to warehouse is used by production for two hours during a shift change, those two hours should not count against warehouse's cost allocation. When a shipping dock calls a warehouse reach truck for an urgent load, the hours should transfer to shipping for the duration of that task. Manual cost tracking systems cannot handle this granularity. The hours get assigned to whichever department the truck is "supposed" to serve, regardless of where it actually operated. This systematic misallocation distorts department cost comparisons and leads to wrong conclusions about which department is efficient and which is not.
Operator Login-Based Allocation
The most accurate allocation method uses operator login data to attribute hours to the department where the operator works, regardless of which department "owns" the forklift. When a production operator logs into a warehouse truck and uses it in the production area, those hours flow to production's cost allocation because the operator's department is production. This approach requires operator login discipline where every operator logs into the correct department at shift start, but it produces allocation accuracy that manual methods cannot achieve. The forklift's home department still receives the depreciation and fixed overhead costs for that unit, while the variable operating costs follow the operator. This split allocation model recognizes that fixed costs stay with the asset owner while variable costs follow the user, which is the most economically accurate approach for shared equipment.
Percentage-Based Allocation for Operator-Login Gaps
Not every facility can implement operator login discipline immediately. For facilities where operator compliance with login procedures is still being established, a percentage-based allocation provides a workable approximation. The allocation splits operating hours based on historical usage patterns. If warehouse uses a specific reach truck 70 percent of the time and production borrows it 30 percent of the time based on historical analysis, the operating costs split 70/30 between those departments. This method is less accurate than operator-login allocation but far more accurate than assigning 100 percent of shared truck costs to the home department. The percentage allocations should be recalculated quarterly as usage patterns change. When operator login compliance improves, transition from percentage-based to login-based allocation to gain the accuracy improvement. If you want to see how FleetRabbit handles both allocation methods and the transition between them, book a demo with FleetRabbit and we will demonstrate the allocation workflow.
Truck Class Cost Comparison: What the Data Typically Reveals
When you first populate a department-by-class cost matrix with accurate data, several patterns typically emerge that were invisible under blended-rate tracking. The most common pattern is that specialized electric equipment like reach trucks and turret trucks carries a 30 to 50 percent higher hourly cost than standard counterbalance trucks in the same department. This premium is expected because specialized equipment has higher purchase prices generating higher depreciation, more complex maintenance requiring specialized technicians, and shorter component life cycles. However, if the premium exceeds 50 percent, it often indicates a maintenance efficiency problem rather than an inherent cost characteristic of the equipment type. High maintenance costs on specialized equipment frequently stem from deferred maintenance cascading into emergency repairs, or from using generalist technicians on equipment that requires specialist knowledge.
The second common pattern is that internal combustion trucks carry a higher total cost per hour than electric trucks in the same application, even though the purchase price of the IC truck is lower. This happens because fuel costs, engine maintenance, and emission system compliance add operating costs that accumulate to exceed the electric truck's higher energy and battery replacement costs over the equipment's life. A counterbalance electric truck at 20 dollars per hour loaded cost may actually be cheaper than a comparable IC truck at 16 dollars per hour when you include all five cost categories because the IC truck's fuel and engine maintenance costs push its true loaded rate above 22 dollars per hour. This pattern only becomes visible when you calculate loaded cost using the full five-category methodology rather than comparing purchase prices or hourly fuel costs in isolation.
Building Department-Level Cost Accountability
Cost tracking data only creates value when it drives accountability. The department manager who sees their forklift costs per hour is 40 percent higher than the plant average has information they cannot ignore. The template should include a monthly cost review process where each department receives their cost-per-hour comparison against the plant average and against their own prior month. Departments above the plant average should be asked to explain the variance. Some variances are legitimate and temporary, caused by seasonal volume shifts, equipment replacement cycles, or one-time maintenance events. Other variances are chronic and addressable, caused by preventable damage, poor operator practices, or deferred maintenance that is catching up. The monthly review process creates a cycle where cost awareness drives cost reduction without requiring top-down mandates. Department managers who see their data every month develop ownership of their cost numbers and self-correct problems that centralized cost management cannot address as effectively.
What the Monthly Review Meeting Should Cover
Building the Template: Data Sources and Calculation Methods
Each of the five cost categories requires a specific data source and calculation method. Getting the data source wrong produces costs that look precise but are fundamentally inaccurate. Labor costs should come from your payroll system using the actual fully-loaded rate for each operator, not an average rate for the department. Fuel and energy costs should come from telematics fuel consumption data or fuel card transactions, not from fuel purchase invoices that include non-forklit fuel. Maintenance costs should come from your work order system with actual labor hours and parts costs, not from budgeted maintenance amounts. Consumables costs should come from purchase records for tires, batteries, and lubricants matched to specific forklifts. Overhead should use a consistent allocation factor applied uniformly across all department-class combinations.
Cost Visibility Is the Prerequisite for Cost Control
You cannot control costs you cannot see. You cannot reduce costs you cannot measure. And you cannot measure costs that are aggregated into categories too broad to reveal where the money goes. The department-by-truck-class cost tracking template creates the measurement foundation that makes cost control possible at the operational level where savings actually occur. When a production manager sees their forklift cost per hour is 40 percent above the plant average, they have specific questions to ask about why. Are their operators causing more damage than other departments. Are their trucks newer or older than average, driving maintenance costs up or down. Are their utilization rates lower, spreading fixed costs over fewer productive hours. Each of these questions leads to an investigation that either validates the cost as necessary for their operation or identifies a specific area where improvement is possible. Without the cost tracking template, none of these questions can be asked with data-backed confidence, and cost management remains a top-down exercise in budget cutting rather than a bottom-up exercise in operational improvement. The template does not reduce costs by itself. It makes costs visible so the people closest to the operations can reduce them.
Stop guessing about which department's forklift operations cost the most and why. FleetRabbit builds your cost tracking matrix automatically from operator login data, telemics fuel consumption, maintenance work orders, and purchase records. See every department's cost per hour by truck class, updated monthly, with trend analysis that shows whether your cost management efforts are working.







