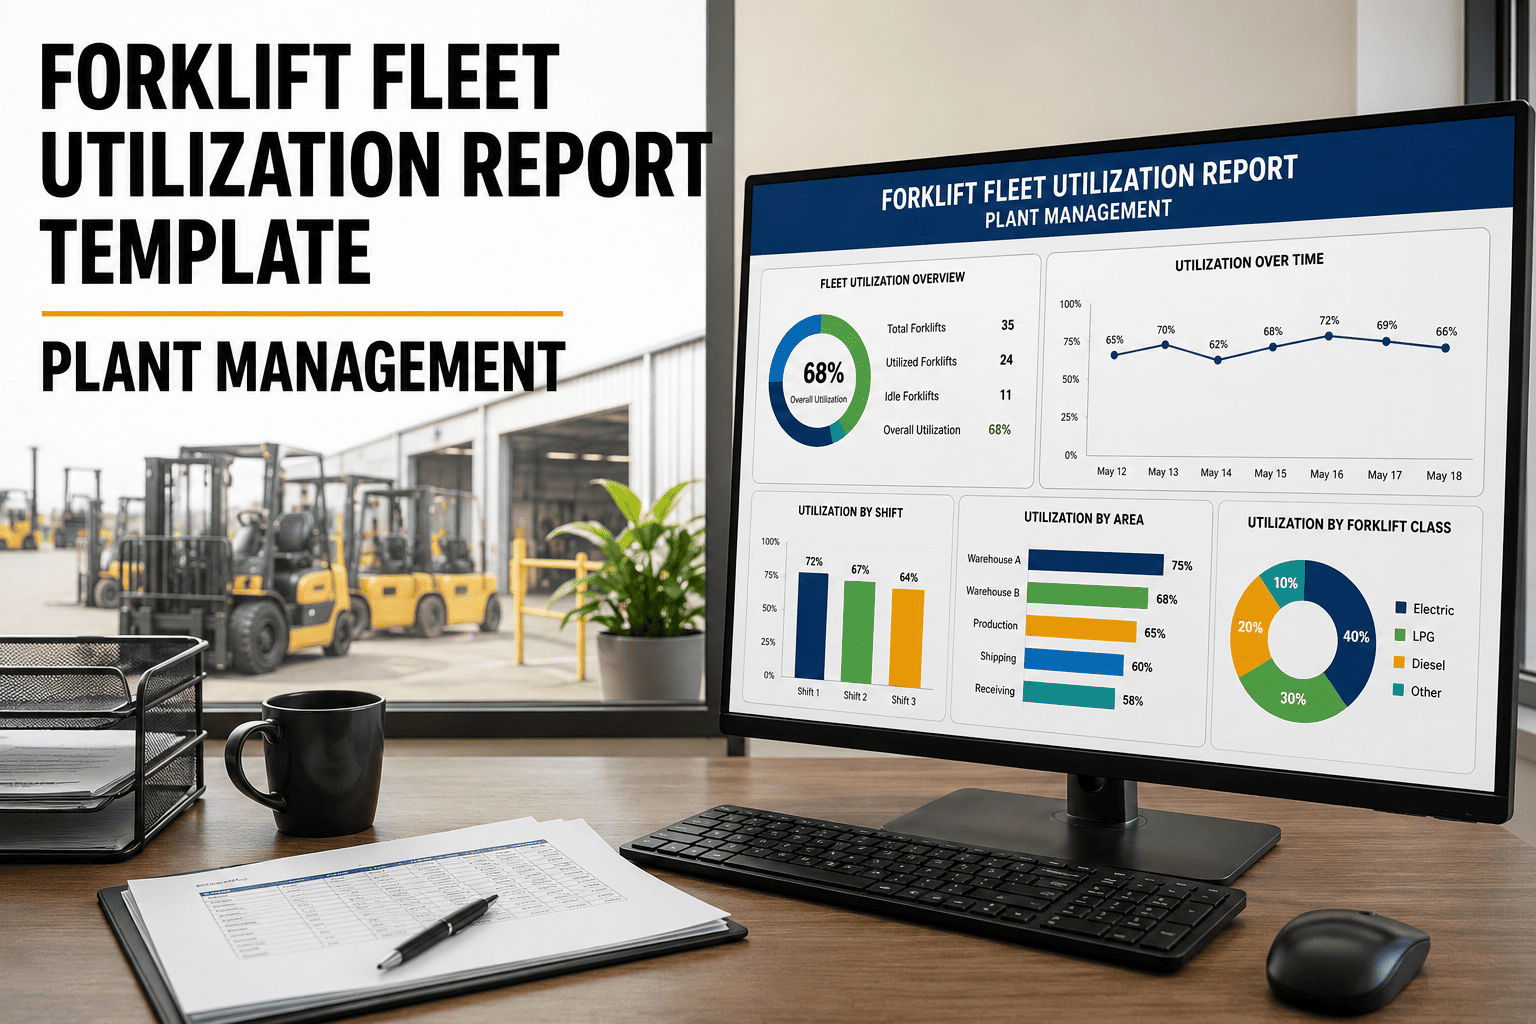
Ask a plant manager how many forklifts they actually need and most will answer with a headcount, not a number backed by data. Trucks get added whenever a department feels short-staffed on equipment, and they rarely get removed, because nobody has a report showing which ones are sitting idle most of the shift. A forklift utilization report closes that gap. It turns a vague sense of "we might have too many trucks" into a specific, defensible number that plant management can act on.
A forklift utilization report tracks drive time, idle time, and not-in-use time for every truck, then converts that into a utilization percentage using active hours divided by available hours. The North American manufacturing average sits around 46.9 percent, while high-performing plants using analytics-driven scheduling reach 65 to 75 percent. Any truck sitting below 40 percent utilization on a sustained basis is a strong candidate for redeployment or removal, and a proper report template surfaces exactly which trucks those are without a manager needing to guess.
What Belongs in a Forklift Utilization Report Template
A useful utilization report is not a single number for the whole fleet. It breaks every truck down into the same set of columns so trucks can be compared side by side, sorted from most to least productive, and flagged automatically when a number falls outside the expected range.
The Core Columns Explained
Every field in the template above answers a specific question a plant manager needs answered during a fleet review.
Drive Hours
The time a truck spends actively moving and doing productive work, the number the utilization percentage is ultimately built around.
Idle Hours
Time the truck is powered on and assigned but not moving, often the first sign of scheduling inefficiency or an oversized fleet for the current workload.
Not-In-Use Hours
Time the truck sits completely unassigned during available shift hours, the clearest signal that a truck may not be needed in its current location at all.
FleetRabbit pulls drive, idle, and not-in-use hours automatically from telematics and builds the utilization report for you, no manual spreadsheet required. Sign up for a free trial and see your fleet's report this week.
Reading the Three Time Buckets Correctly
A fleet-wide average hides more than it reveals. Two trucks can both average 50 percent utilization while telling completely different operational stories, and the report only becomes useful once idle and not-in-use hours are read separately instead of lumped together.
High Idle, Low Not-In-Use
The truck is assigned and present but waiting frequently, usually pointing to a scheduling or process bottleneck rather than a fleet size problem.
Low Idle, High Not-In-Use
The truck runs efficiently whenever it is used, but sits unassigned for long stretches, a strong signal the fleet may simply own one more truck than it needs.
High Idle and High Not-In-Use
The clearest right-sizing candidate. This truck is neither working nor assigned productively for most of its available hours.
Why Utilization Is an Efficiency Metric, Not an Effectiveness Metric
A high utilization number means the truck is being used, not that it is being used well. A truck running at 85 percent utilization on inefficient routes still represents wasted labor and fuel even though the number looks strong on the report. Utilization tells you what is running. It takes a second look at drive patterns to tell you whether that running is actually efficient.
Turning the Report Into a Fleet Decision
| Utilization Range | What It Usually Means | Recommended Action |
|---|---|---|
| 65% and Above | Truck is working near or above the high-performer benchmark | Maintain current assignment, monitor for overwork wear |
| 40% to 64% | Within the typical manufacturing range but with room to improve | Review scheduling and zone assignment before adding trucks |
| Below 40% | Sustained underuse relative to fleet peers | Candidate for redeployment, reassignment, or removal |
Average fleets waste a meaningful share of their annual budget through underutilized assets sitting on the balance sheet without earning their keep. A report that surfaces this at the individual truck level, rather than as a single fleet-wide average, is what lets plant management justify a fleet reduction or a reallocation with real numbers instead of an educated guess.
FleetRabbit flags trucks below your utilization threshold automatically, so redeployment and right-sizing decisions come from data instead of a hunch. Book a demo and walk through your own fleet's utilization report.
A utilization report is only valuable if it changes a decision. Plants that pull this data monthly and act on it, redeploying the low performers and protecting the high performers from overwork, are the ones that stop adding trucks reactively and start managing their fleet size deliberately. The report itself takes minutes to generate once the right system is in place. What it saves in unnecessary lease and depreciation costs is measured in months, not minutes.
FleetRabbit builds a per-truck utilization report from real telematics data, so plant management always knows which trucks are earning their spot on the floor. Start free and see your first report within days, no credit card required.







